[←][→] ath
| functional annotation | ||||||||||||||||||||||||||||||||||||||||||||||||||
| Function | Glucose-1-phosphate adenylyltransferase family protein |


|
||||||||||||||||||||||||||||||||||||||||||||||||
| GO BP |
|
|||||||||||||||||||||||||||||||||||||||||||||||||
| GO CC |
|
|||||||||||||||||||||||||||||||||||||||||||||||||
| GO MF |
|
|||||||||||||||||||||||||||||||||||||||||||||||||
| KEGG | ath00051 [list] [network] Fructose and mannose metabolism (63 genes) |  |
||||||||||||||||||||||||||||||||||||||||||||||||
| ath00520 [list] [network] Amino sugar and nucleotide sugar metabolism (133 genes) | |
|||||||||||||||||||||||||||||||||||||||||||||||||
| ath01240 [list] [network] Biosynthesis of cofactors (236 genes) | |
|||||||||||||||||||||||||||||||||||||||||||||||||
| ath01250 [list] [network] Biosynthesis of nucleotide sugars (100 genes) | |
|||||||||||||||||||||||||||||||||||||||||||||||||
| Protein | NP_001189713.1 NP_001325272.1 NP_181507.1 | |||||||||||||||||||||||||||||||||||||||||||||||||
| BLAST | NP_001189713.1 NP_001325272.1 NP_181507.1 | |||||||||||||||||||||||||||||||||||||||||||||||||
| Orthologous | [Ortholog page] GMP (sly) AT3G55590 (ath) AT4G30570 (ath) LOC4327472 (osa) LOC4332373 (osa) LOC4345021 (osa) LOC7487278 (ppo) LOC7487979 (ppo) LOC7490373 (ppo) LOC11405162 (mtr) GMP1 (gma) GMP2 (gma) LOC100808375 (gma) LOC100818016 (gma) LOC101248982 (sly) LOC101257102 (sly) VTC1 (bra) LOC103858576 (bra) LOC103861976 (bra) LOC103861979 (bra) LOC103865745 (bra) LOC103867013 (bra) LOC123062589 (tae) LOC123071405 (tae) LOC123079747 (tae) LOC123085408 (tae) LOC123092627 (tae) LOC123097937 (tae) LOC123444901 (hvu) LOC123449043 (hvu) | |||||||||||||||||||||||||||||||||||||||||||||||||
| Subcellular localization wolf |
|
|||||||||||||||||||||||||||||||||||||||||||||||||
| Subcellular localization TargetP |
|
|||||||||||||||||||||||||||||||||||||||||||||||||
| Gene coexpression | ||||||||||||||||||||||||||||||||||||||||||||||||||
| Network*for coexpressed genes |
|
|||||||||||||||||||||||||||||||||||||||||||||||||
|---|---|---|---|---|---|---|---|---|---|---|---|---|---|---|---|---|---|---|---|---|---|---|---|---|---|---|---|---|---|---|---|---|---|---|---|---|---|---|---|---|---|---|---|---|---|---|---|---|---|---|
| Coexpressed gene list |
[Coexpressed gene list for CYT1] | |||||||||||||||||||||||||||||||||||||||||||||||||
| Gene expression | ||||||||||||||||||||||||||||||||||||||||||||||||||
| All samples | [Expression pattern for all samples] | |||||||||||||||||||||||||||||||||||||||||||||||||
| AtGenExpress* (Development) |
245060_at
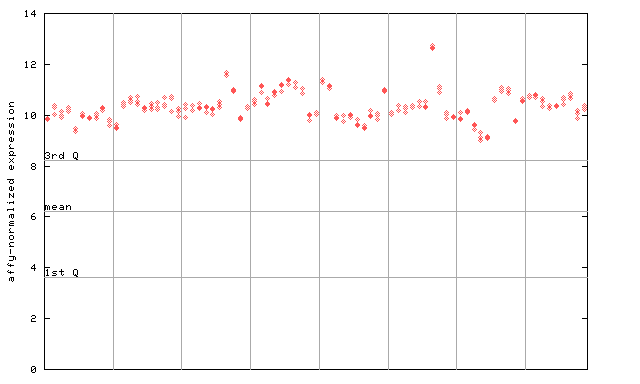
X axis is samples (pdf file), and Y axis is log2-expression. |
|||||||||||||||||||||||||||||||||||||||||||||||||
| AtGenExpress* (Stress) |
245060_at
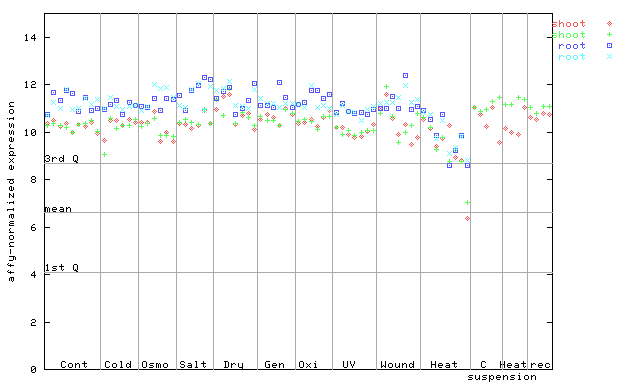
X axis is samples (pdf file), and Y axis is log2-expression. |
|||||||||||||||||||||||||||||||||||||||||||||||||
| AtGenExpress* (Hormone) |
245060_at
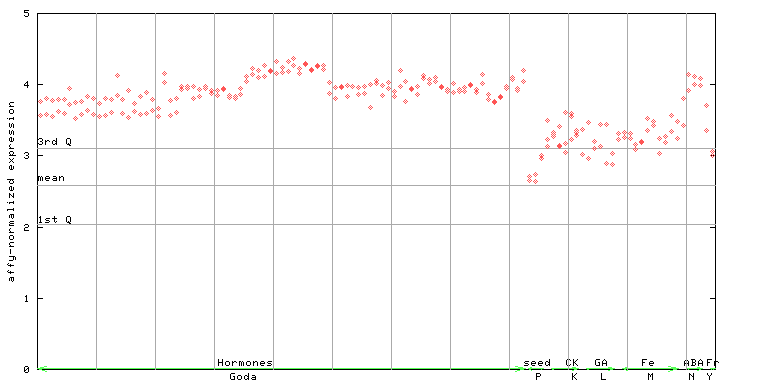
X axis is samples (xls file), and Y axis is log-expression. |
|||||||||||||||||||||||||||||||||||||||||||||||||


")
")
")
")
")
| Link to other DBs | ||
| Entrez Gene ID | 818562 |
|
| Refseq ID (protein) | NP_001189713.1 | |
| NP_001325272.1 | |
|
| NP_181507.1 | |
|
The preparation time of this page was 0.2 [sec].