[←][→] ath
| functional annotation | ||||||||||||||||||||||||||||||||||||||||||||||||||||
| Function | S-formylglutathione hydrolase |


|
||||||||||||||||||||||||||||||||||||||||||||||||||
| GO BP |
|
|||||||||||||||||||||||||||||||||||||||||||||||||||
| GO CC |
|
|||||||||||||||||||||||||||||||||||||||||||||||||||
| GO MF |
|
|||||||||||||||||||||||||||||||||||||||||||||||||||
| KEGG | ath01200 [list] [network] Carbon metabolism (273 genes) |  |
||||||||||||||||||||||||||||||||||||||||||||||||||
| Protein | NP_181684.1 | |||||||||||||||||||||||||||||||||||||||||||||||||||
| BLAST | NP_181684.1 | |||||||||||||||||||||||||||||||||||||||||||||||||||
| Orthologous | [Ortholog page] LOC4326513 (osa) LOC7473598 (ppo) LOC25483373 (mtr) LOC25491280 (mtr) LOC100253701 (vvi) LOC100282053 (zma) LOC100786814 (gma) LOC100796669 (gma) LOC101260331 (sly) LOC103857985 (bra) LOC103866563 (bra) | |||||||||||||||||||||||||||||||||||||||||||||||||||
| Subcellular localization wolf |
|
|||||||||||||||||||||||||||||||||||||||||||||||||||
| Subcellular localization TargetP |
|
|||||||||||||||||||||||||||||||||||||||||||||||||||
| Gene coexpression | ||||||||||||||||||||||||||||||||||||||||||||||||||||
| Network*for coexpressed genes |
|
|||||||||||||||||||||||||||||||||||||||||||||||||||
|---|---|---|---|---|---|---|---|---|---|---|---|---|---|---|---|---|---|---|---|---|---|---|---|---|---|---|---|---|---|---|---|---|---|---|---|---|---|---|---|---|---|---|---|---|---|---|---|---|---|---|---|---|
| Coexpressed gene list |
[Coexpressed gene list for SFGH] | |||||||||||||||||||||||||||||||||||||||||||||||||||
| Gene expression | ||||||||||||||||||||||||||||||||||||||||||||||||||||
| All samples | [Expression pattern for all samples] | |||||||||||||||||||||||||||||||||||||||||||||||||||
| AtGenExpress* (Development) |
245115_at
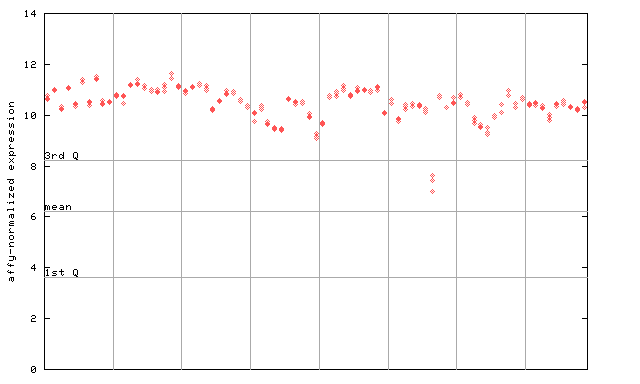
X axis is samples (pdf file), and Y axis is log2-expression. |
|||||||||||||||||||||||||||||||||||||||||||||||||||
| AtGenExpress* (Stress) |
245115_at
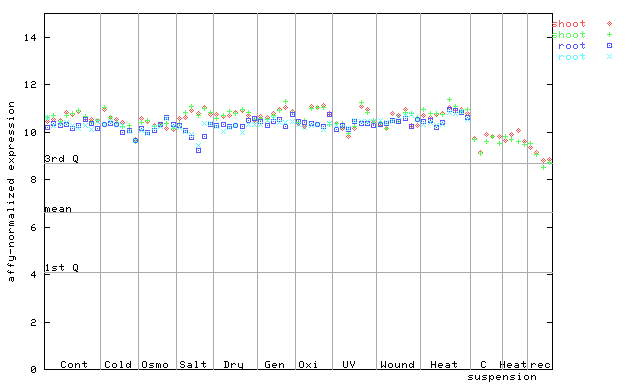
X axis is samples (pdf file), and Y axis is log2-expression. |
|||||||||||||||||||||||||||||||||||||||||||||||||||
| AtGenExpress* (Hormone) |
245115_at
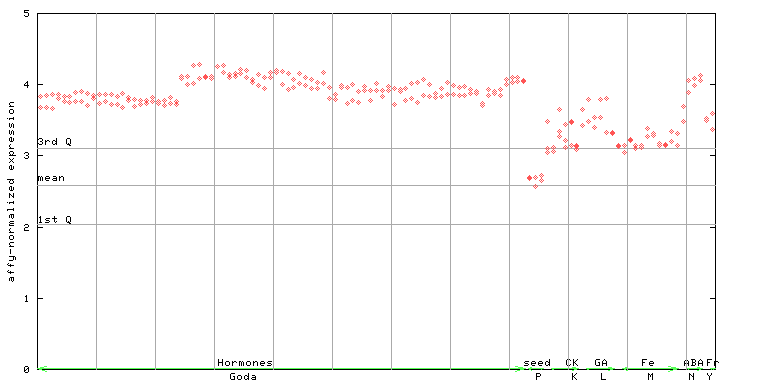
X axis is samples (xls file), and Y axis is log-expression. |
|||||||||||||||||||||||||||||||||||||||||||||||||||


")
")
")
| Link to other DBs | ||
| Entrez Gene ID | 818751 |
|
| Refseq ID (protein) | NP_181684.1 | |
The preparation time of this page was 0.2 [sec].