[←][→] ath
| functional annotation | ||||||
| Function | F-box and associated interaction domains-containing protein |


|
||||
| GO BP |
|
|||||
| GO CC |
|
|||||
| GO MF |
|
|||||
| KEGG | ||||||
| Protein | NP_001189741.1 NP_181856.1 | |||||
| BLAST | NP_001189741.1 NP_181856.1 | |||||
| Orthologous | [Ortholog page] AT2G30615 (ath) AT2G42955 (ath) AT2G43260 (ath) AT2G43440 (ath) AT4G17780 (ath) AT1G49790 (ath) AT2G43445 (ath) AT2G30385 (ath) LOC103829182 (bra) LOC103856869 (bra) LOC103861158 (bra) LOC103865230 (bra) LOC103866165 (bra) LOC103866707 (bra) LOC103874500 (bra) | |||||
| Subcellular localization wolf |
|
|||||
| Subcellular localization TargetP |
|
|||||
| Gene coexpression | ||||||
| Network*for coexpressed genes |
||||||
|---|---|---|---|---|---|---|
| Coexpressed gene list |
[Coexpressed gene list for AT2G43270] | |||||
| Gene expression | ||||||
| All samples | [Expression pattern for all samples] | |||||
| AtGenExpress* (Development) |
266443_at
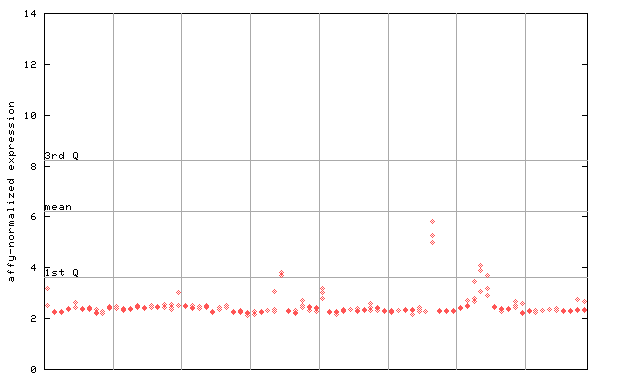
X axis is samples (pdf file), and Y axis is log2-expression. |
|||||
| AtGenExpress* (Stress) |
266443_at
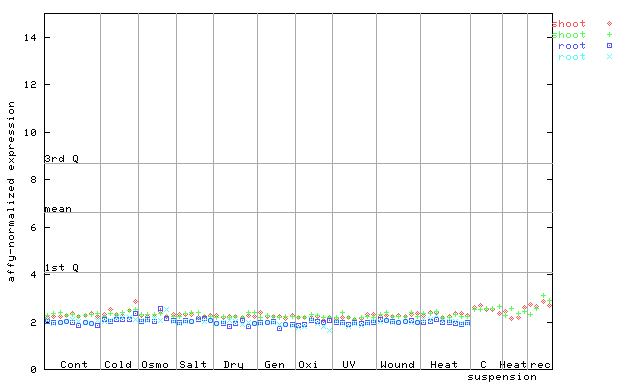
X axis is samples (pdf file), and Y axis is log2-expression. |
|||||
| AtGenExpress* (Hormone) |
266443_at
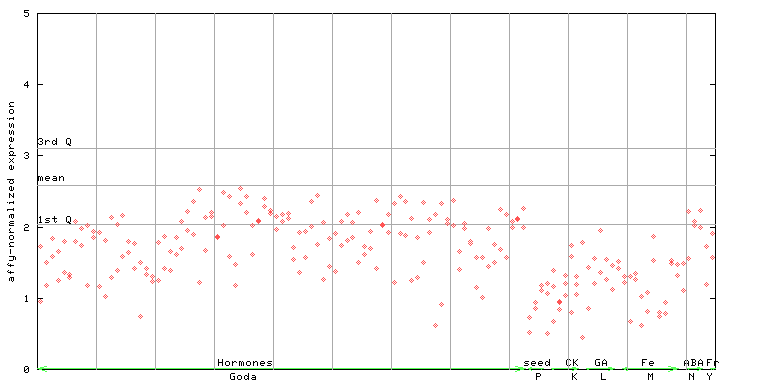
X axis is samples (xls file), and Y axis is log-expression. |
|||||

| Link to other DBs | ||
| Entrez Gene ID | 818929 |
|
| Refseq ID (protein) | NP_001189741.1 | |
| NP_181856.1 | |
|
The preparation time of this page was 0.1 [sec].