[←][→] ath
| functional annotation | ||||||||||||||||||
| Function | Chitinase family protein |


|
||||||||||||||||
| GO BP |
|
|||||||||||||||||
| GO CC |
|
|||||||||||||||||
| GO MF |
|
|||||||||||||||||
| KEGG | ath00520 [list] [network] Amino sugar and nucleotide sugar metabolism (131 genes) |  |
||||||||||||||||
| Protein | NP_001318415.1 NP_181888.2 | |||||||||||||||||
| BLAST | NP_001318415.1 NP_181888.2 | |||||||||||||||||
| Orthologous | [Ortholog page] LOC103860061 (bra) | |||||||||||||||||
| Subcellular localization wolf |
|
|||||||||||||||||
| Subcellular localization TargetP |
|
|||||||||||||||||
| Gene coexpression | ||||||||||||||||||
| Network*for coexpressed genes |
||||||||||||||||||
|---|---|---|---|---|---|---|---|---|---|---|---|---|---|---|---|---|---|---|
| Coexpressed gene list |
[Coexpressed gene list for AT2G43600] | |||||||||||||||||
| Gene expression | ||||||||||||||||||
| All samples | [Expression pattern for all samples] | |||||||||||||||||
| AtGenExpress* (Development) |
260558_at
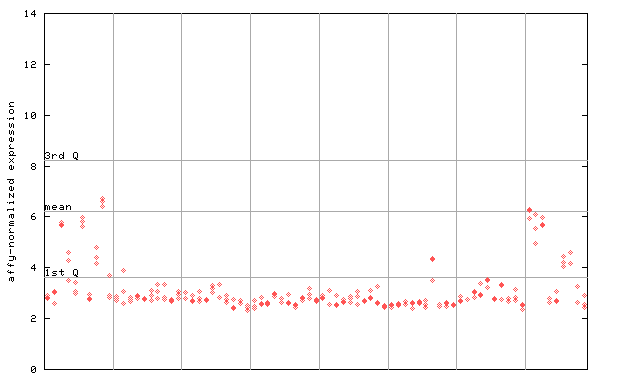
X axis is samples (pdf file), and Y axis is log2-expression. |
|||||||||||||||||
| AtGenExpress* (Stress) |
260558_at
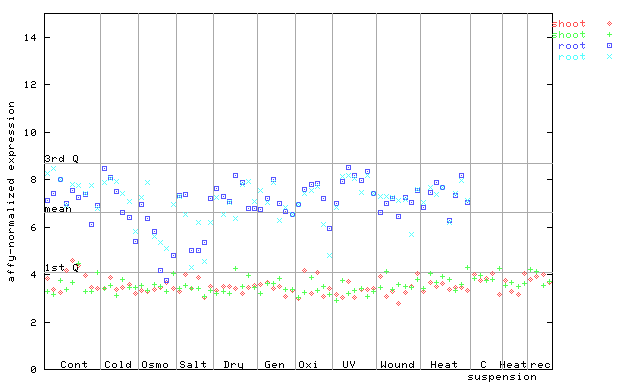
X axis is samples (pdf file), and Y axis is log2-expression. |
|||||||||||||||||
| AtGenExpress* (Hormone) |
260558_at
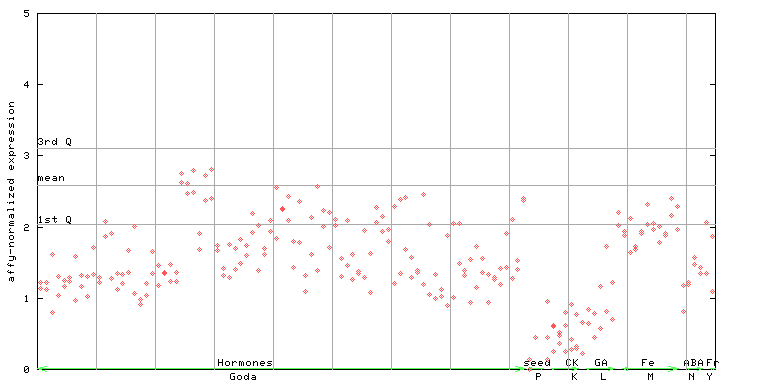
X axis is samples (xls file), and Y axis is log-expression. |
|||||||||||||||||

| Link to other DBs | ||
| Entrez Gene ID | 818962 |
|
| Refseq ID (protein) | NP_001318415.1 | |
| NP_181888.2 | |
|
The preparation time of this page was 0.2 [sec].