[←][→] ath
| functional annotation | ||||||||||||||||||||||||||||||||||||||||||||
| Function | mitochondrial acyl carrier protein 1 |


|
||||||||||||||||||||||||||||||||||||||||||
| GO BP |
|
|||||||||||||||||||||||||||||||||||||||||||
| GO CC |
|
|||||||||||||||||||||||||||||||||||||||||||
| GO MF |
|
|||||||||||||||||||||||||||||||||||||||||||
| KEGG | ath00190 [list] [network] Oxidative phosphorylation (170 genes) |  |
||||||||||||||||||||||||||||||||||||||||||
| Protein | NP_181990.1 | |||||||||||||||||||||||||||||||||||||||||||
| BLAST | NP_181990.1 | |||||||||||||||||||||||||||||||||||||||||||
| Orthologous | [Ortholog page] LOC4342743 (osa) LOC7483788 (ppo) LOC11426055 (mtr) LOC18105031 (ppo) LOC100306438 (gma) LOC100818873 (gma) LOC101245883 (sly) LOC103858136 (bra) LOC103866817 (bra) LOC123150952 (tae) LOC123157799 (tae) LOC123167631 (tae) LOC123410827 (hvu) | |||||||||||||||||||||||||||||||||||||||||||
| Subcellular localization wolf |
|
|||||||||||||||||||||||||||||||||||||||||||
| Subcellular localization TargetP |
|
|||||||||||||||||||||||||||||||||||||||||||
| Gene coexpression | ||||||||||||||||||||||||||||||||||||||||||||
| Network*for coexpressed genes |
|
|||||||||||||||||||||||||||||||||||||||||||
|---|---|---|---|---|---|---|---|---|---|---|---|---|---|---|---|---|---|---|---|---|---|---|---|---|---|---|---|---|---|---|---|---|---|---|---|---|---|---|---|---|---|---|---|---|
| Coexpressed gene list |
[Coexpressed gene list for MTACP-1] | |||||||||||||||||||||||||||||||||||||||||||
| Gene expression | ||||||||||||||||||||||||||||||||||||||||||||
| All samples | [Expression pattern for all samples] | |||||||||||||||||||||||||||||||||||||||||||
| AtGenExpress* (Development) |
266890_at
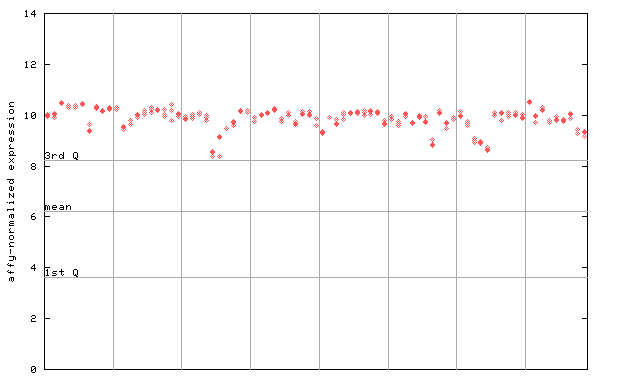
X axis is samples (pdf file), and Y axis is log2-expression. |
|||||||||||||||||||||||||||||||||||||||||||
| AtGenExpress* (Stress) |
266890_at
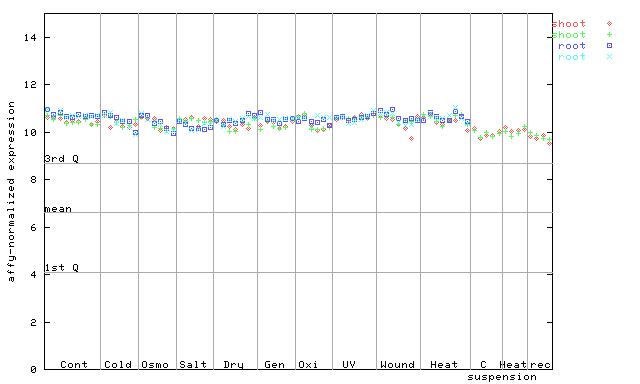
X axis is samples (pdf file), and Y axis is log2-expression. |
|||||||||||||||||||||||||||||||||||||||||||
| AtGenExpress* (Hormone) |
266890_at
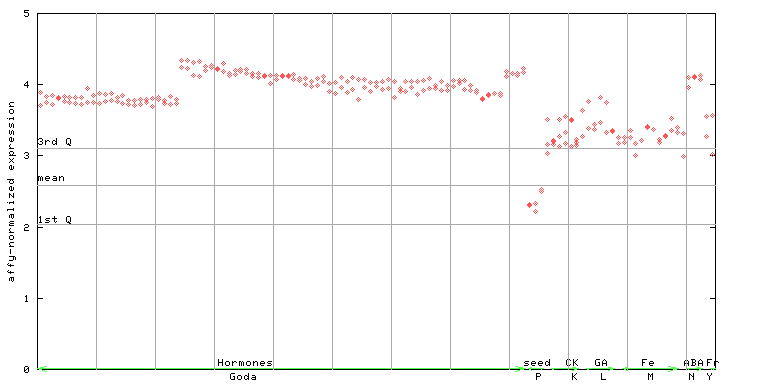
X axis is samples (xls file), and Y axis is log-expression. |
|||||||||||||||||||||||||||||||||||||||||||


")
| Link to other DBs | ||
| Entrez Gene ID | 819070 |
|
| Refseq ID (protein) | NP_181990.1 | |
The preparation time of this page was 0.1 [sec].