[←][→] ath
| functional annotation | ||||||||||||||
| Function | U-box domain-containing protein kinase family protein |


|
||||||||||||
| GO BP |
|
|||||||||||||
| GO CC |
|
|||||||||||||
| GO MF |
|
|||||||||||||
| KEGG | ||||||||||||||
| Protein | NP_001324111.1 NP_182115.2 | |||||||||||||
| BLAST | NP_001324111.1 NP_182115.2 | |||||||||||||
| Orthologous | [Ortholog page] LOC4347909 (osa) LOC4349302 (osa) LOC7461773 (ppo) LOC7494076 (ppo) LOC11439401 (mtr) LOC11440397 (mtr) LOC100243070 (vvi) LOC100780079 (gma) LOC100781596 (gma) LOC100807515 (gma) LOC100810508 (gma) LOC101249019 (sly) LOC103653883 (zma) LOC103866250 (bra) LOC103866933 (bra) | |||||||||||||
| Subcellular localization wolf |
|
|||||||||||||
| Subcellular localization TargetP |
|
|||||||||||||
| Gene coexpression | ||||||||||||||
| Network*for coexpressed genes |
||||||||||||||
|---|---|---|---|---|---|---|---|---|---|---|---|---|---|---|
| Coexpressed gene list |
[Coexpressed gene list for AT2G45910] | |||||||||||||
| Gene expression | ||||||||||||||
| All samples | [Expression pattern for all samples] | |||||||||||||
| AtGenExpress* (Development) |
266911_at
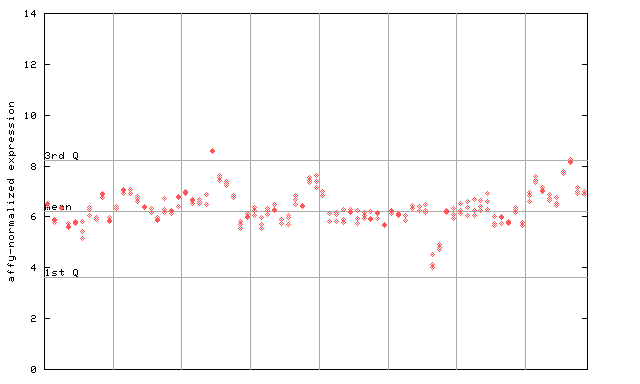
X axis is samples (pdf file), and Y axis is log2-expression. |
|||||||||||||
| AtGenExpress* (Stress) |
266911_at
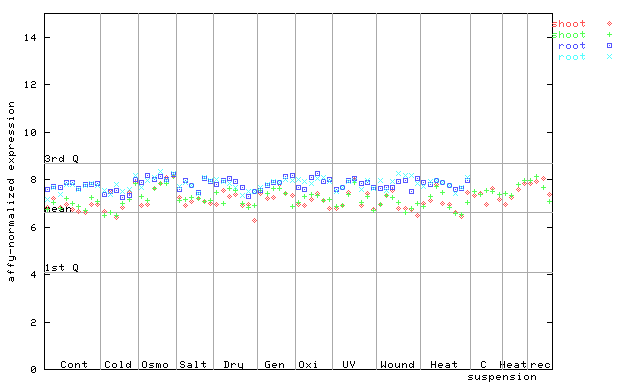
X axis is samples (pdf file), and Y axis is log2-expression. |
|||||||||||||
| AtGenExpress* (Hormone) |
266911_at
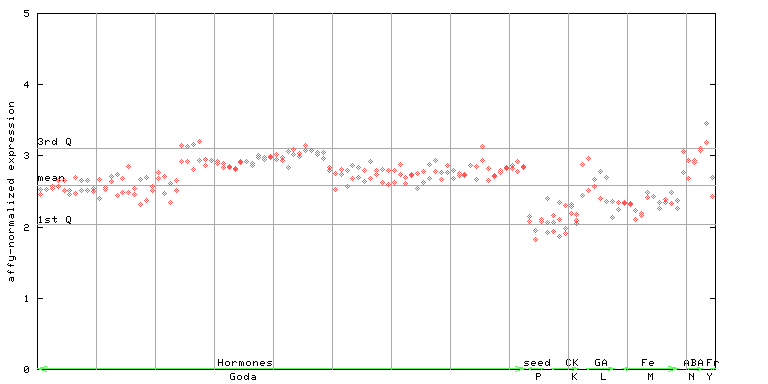
X axis is samples (xls file), and Y axis is log-expression. |
|||||||||||||


| Link to other DBs | ||
| Entrez Gene ID | 819199 |
|
| Refseq ID (protein) | NP_001324111.1 | |
| NP_182115.2 | |
|
The preparation time of this page was 0.3 [sec].