[←][→] ath
| functional annotation | ||||||||||||||||||||||||||
| Function | Peptide chain release factor 1 |


|
||||||||||||||||||||||||
| GO BP |
|
|||||||||||||||||||||||||
| GO CC |
|
|||||||||||||||||||||||||
| GO MF |
|
|||||||||||||||||||||||||
| KEGG | ||||||||||||||||||||||||||
| Protein | NP_001318439.1 NP_001323990.1 NP_001323991.1 NP_001323992.1 NP_182225.3 | |||||||||||||||||||||||||
| BLAST | NP_001318439.1 NP_001323990.1 NP_001323991.1 NP_001323992.1 NP_182225.3 | |||||||||||||||||||||||||
| Orthologous | [Ortholog page] LOC4338281 (osa) LOC7495184 (ppo) LOC11423415 (mtr) LOC100800412 (gma) LOC101244063 (sly) LOC117134033 (bra) LOC123110836 (tae) LOC123180343 (tae) LOC123190404 (tae) LOC123422270 (hvu) | |||||||||||||||||||||||||
| Subcellular localization wolf |
|
|||||||||||||||||||||||||
| Subcellular localization TargetP |
|
|||||||||||||||||||||||||
| Gene coexpression | ||||||||||||||||||||||||||
| Network*for coexpressed genes |
|
|||||||||||||||||||||||||
|---|---|---|---|---|---|---|---|---|---|---|---|---|---|---|---|---|---|---|---|---|---|---|---|---|---|---|
| Coexpressed gene list |
[Coexpressed gene list for AT2G47020] | |||||||||||||||||||||||||
| Gene expression | ||||||||||||||||||||||||||
| All samples | [Expression pattern for all samples] | |||||||||||||||||||||||||
| AtGenExpress* (Development) |
266751_at
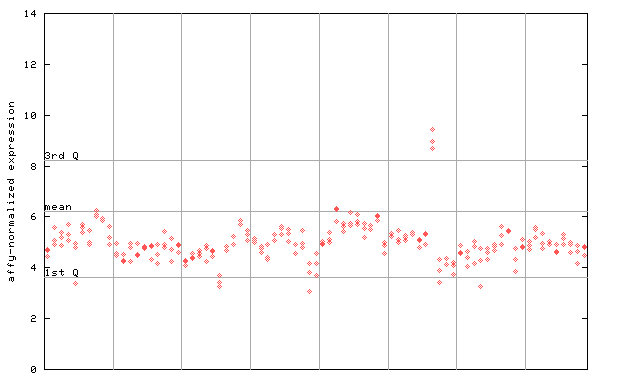
X axis is samples (pdf file), and Y axis is log2-expression. |
|||||||||||||||||||||||||
| AtGenExpress* (Stress) |
266751_at
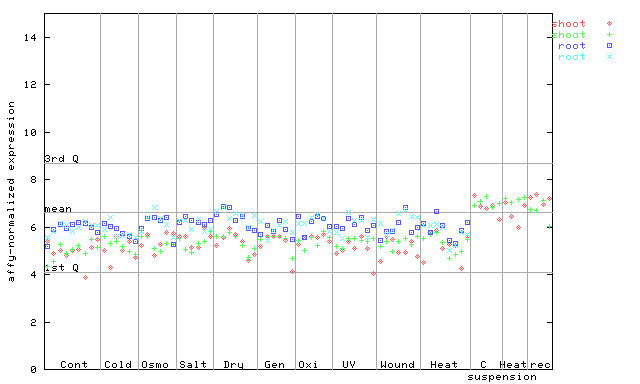
X axis is samples (pdf file), and Y axis is log2-expression. |
|||||||||||||||||||||||||
| AtGenExpress* (Hormone) |
266751_at
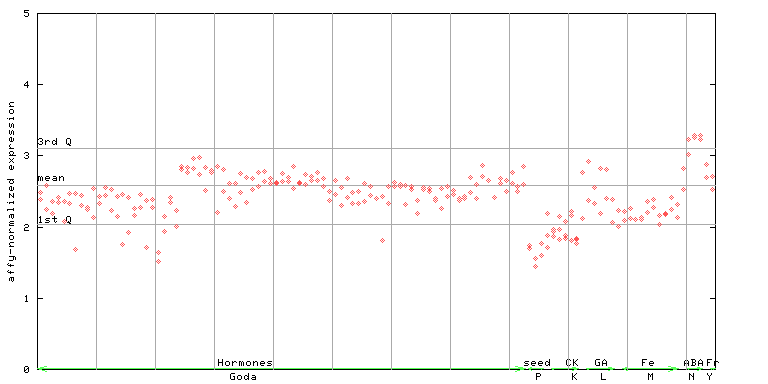
X axis is samples (xls file), and Y axis is log-expression. |
|||||||||||||||||||||||||


| Link to other DBs | ||
| Entrez Gene ID | 819316 |
|
| Refseq ID (protein) | NP_001318439.1 | |
| NP_001323990.1 | |
|
| NP_001323991.1 | |
|
| NP_001323992.1 | |
|
| NP_182225.3 | |
|
The preparation time of this page was 0.1 [sec].