[←][→] ath
| functional annotation | ||||||||||||||||||||||||||||||||||
| Function | Prolyl oligopeptidase family protein |

 Plant GARDEN Plant GARDEN JBrowse
|
||||||||||||||||||||||||||||||||
| GO BP |
|
|||||||||||||||||||||||||||||||||
| GO CC |
|
|||||||||||||||||||||||||||||||||
| GO MF |
|
|||||||||||||||||||||||||||||||||
| KEGG | ||||||||||||||||||||||||||||||||||
| Protein | NP_850473.1 | |||||||||||||||||||||||||||||||||
| BLAST | NP_850473.1 | |||||||||||||||||||||||||||||||||
| Orthologous | [Ortholog page] LOC547526 (gma) LOC4332606 (osa) LOC4344360 (osa) LOC7455430 (ppo) LOC7460457 (ppo) LOC11432527 (mtr) LOC100812716 (gma) LOC101267841 (sly) LOC103866385 (bra) LOC123043597 (tae) LOC123051463 (tae) LOC123085666 (tae) LOC123097679 (tae) LOC123424645 (hvu) LOC123448828 (hvu) | |||||||||||||||||||||||||||||||||
| Subcellular localization wolf |
|
|||||||||||||||||||||||||||||||||
| Subcellular localization TargetP |
|
|||||||||||||||||||||||||||||||||
| Gene coexpression | ||||||||||||||||||||||||||||||||||
| Network*for coexpressed genes |
|
|||||||||||||||||||||||||||||||||
|---|---|---|---|---|---|---|---|---|---|---|---|---|---|---|---|---|---|---|---|---|---|---|---|---|---|---|---|---|---|---|---|---|---|---|
| Coexpressed gene list |
[Coexpressed gene list for AT2G47390] | |||||||||||||||||||||||||||||||||
| Gene expression | ||||||||||||||||||||||||||||||||||
| All samples | [Expression pattern for all samples] | |||||||||||||||||||||||||||||||||
| AtGenExpress* (Development) |
260580_at
X axis is samples (pdf file), and Y axis is log2-expression. |
|||||||||||||||||||||||||||||||||
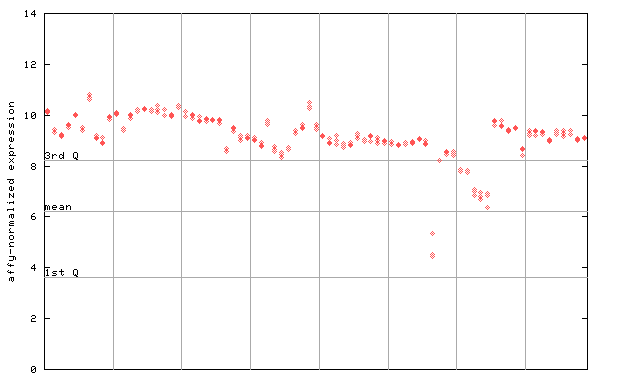
| AtGenExpress* (Stress) |
260580_at
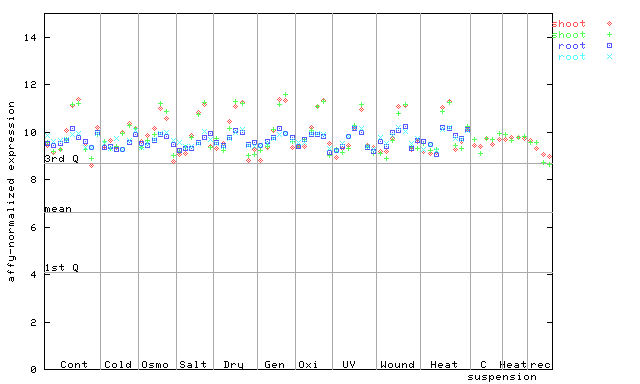
X axis is samples (pdf file), and Y axis is log2-expression. |
|||||||||||||||||||||||||||||||||
| AtGenExpress* (Hormone) |
260580_at
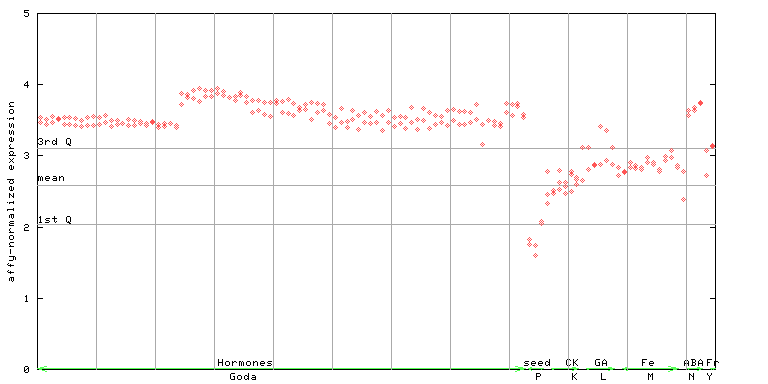
X axis is samples (xls file), and Y axis is log-expression. |
|||||||||||||||||||||||||||||||||


")
| Link to other DBs | ||
| Entrez Gene ID | 819352 |
|
| Refseq ID (protein) | NP_850473.1 | |
The preparation time of this page was 0.5 [sec].