[←][→] ath
| functional annotation | |||||||||||||||||||||||||||||||||||||||||||||||||||
| Function | beta glucosidase 25 |


|
|||||||||||||||||||||||||||||||||||||||||||||||||
| GO BP |
|
||||||||||||||||||||||||||||||||||||||||||||||||||
| GO CC |
|
||||||||||||||||||||||||||||||||||||||||||||||||||
| GO MF |
|
||||||||||||||||||||||||||||||||||||||||||||||||||
| KEGG | ath00460 [list] [network] Cyanoamino acid metabolism (69 genes) |  |
|||||||||||||||||||||||||||||||||||||||||||||||||
| ath00500 [list] [network] Starch and sucrose metabolism (165 genes) | |
||||||||||||||||||||||||||||||||||||||||||||||||||
| ath00940 [list] [network] Phenylpropanoid biosynthesis (166 genes) | |
||||||||||||||||||||||||||||||||||||||||||||||||||
| Protein | NP_187014.1 | ||||||||||||||||||||||||||||||||||||||||||||||||||
| BLAST | NP_187014.1 | ||||||||||||||||||||||||||||||||||||||||||||||||||
| Orthologous | [Ortholog page] LOC103828204 (bra) | ||||||||||||||||||||||||||||||||||||||||||||||||||
| Subcellular localization wolf |
|
||||||||||||||||||||||||||||||||||||||||||||||||||
| Subcellular localization TargetP |
|
||||||||||||||||||||||||||||||||||||||||||||||||||
| Gene coexpression | |||||||||||||||||||||||||||||||||||||||||||||||||||
| Network*for coexpressed genes |
|
||||||||||||||||||||||||||||||||||||||||||||||||||
|---|---|---|---|---|---|---|---|---|---|---|---|---|---|---|---|---|---|---|---|---|---|---|---|---|---|---|---|---|---|---|---|---|---|---|---|---|---|---|---|---|---|---|---|---|---|---|---|---|---|---|---|
| Coexpressed gene list |
[Coexpressed gene list for BGLU25] | ||||||||||||||||||||||||||||||||||||||||||||||||||
| Gene expression | |||||||||||||||||||||||||||||||||||||||||||||||||||
| All samples | [Expression pattern for all samples] | ||||||||||||||||||||||||||||||||||||||||||||||||||
| AtGenExpress* (Development) |
259173_at
X axis is samples (pdf file), and Y axis is log2-expression. |
||||||||||||||||||||||||||||||||||||||||||||||||||
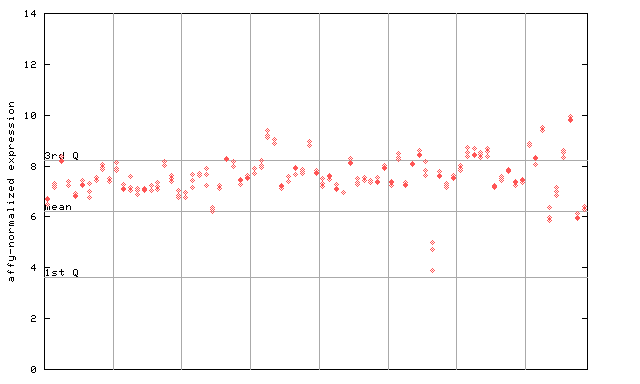
| AtGenExpress* (Stress) |
259173_at
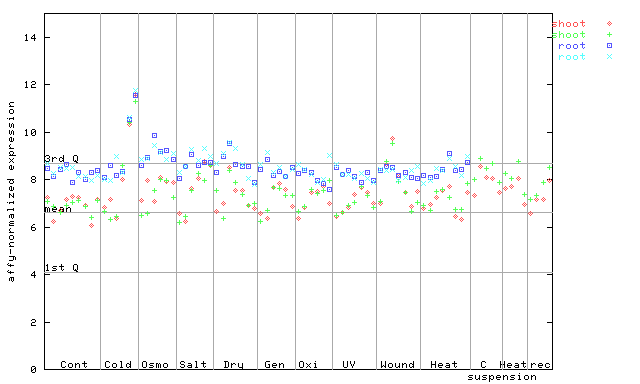
X axis is samples (pdf file), and Y axis is log2-expression. |
||||||||||||||||||||||||||||||||||||||||||||||||||
| AtGenExpress* (Hormone) |
259173_at
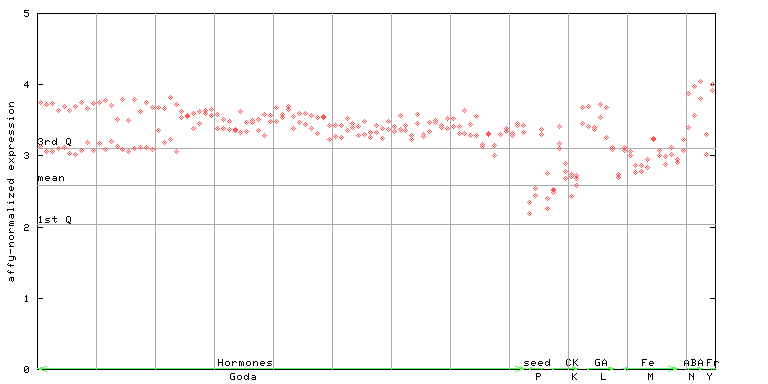
X axis is samples (xls file), and Y axis is log-expression. |
||||||||||||||||||||||||||||||||||||||||||||||||||


")
")
")
")
| Link to other DBs | ||
| Entrez Gene ID | 821201 |
|
| Refseq ID (protein) | NP_187014.1 | |
The preparation time of this page was 0.2 [sec].