[←][→] ath
| functional annotation | |||||||||||||||||||||||||||||||||||||||||||||||||||||||
| Function | acyl-CoA dehydrogenase-like protein |


|
|||||||||||||||||||||||||||||||||||||||||||||||||||||
| GO BP |
|
||||||||||||||||||||||||||||||||||||||||||||||||||||||
| GO CC |
|
||||||||||||||||||||||||||||||||||||||||||||||||||||||
| GO MF |
|
||||||||||||||||||||||||||||||||||||||||||||||||||||||
| KEGG | ath00071 [list] [network] Fatty acid degradation (47 genes) |  |
|||||||||||||||||||||||||||||||||||||||||||||||||||||
| ath00280 [list] [network] Valine, leucine and isoleucine degradation (52 genes) | |
||||||||||||||||||||||||||||||||||||||||||||||||||||||
| ath01212 [list] [network] Fatty acid metabolism (70 genes) | |
||||||||||||||||||||||||||||||||||||||||||||||||||||||
| Protein | NP_187337.2 | ||||||||||||||||||||||||||||||||||||||||||||||||||||||
| BLAST | NP_187337.2 | ||||||||||||||||||||||||||||||||||||||||||||||||||||||
| Orthologous | [Ortholog page] LOC4344267 (osa) LOC7496669 (ppo) LOC18096529 (ppo) LOC25488070 (mtr) LOC100778771 (gma) LOC100788184 (gma) LOC101261954 (sly) LOC101267526 (sly) LOC103870719 (bra) LOC123051574 (tae) LOC123187505 (tae) LOC123424737 (hvu) | ||||||||||||||||||||||||||||||||||||||||||||||||||||||
| Subcellular localization wolf |
|
||||||||||||||||||||||||||||||||||||||||||||||||||||||
| Subcellular localization TargetP |
|
||||||||||||||||||||||||||||||||||||||||||||||||||||||
| Gene coexpression | |||||||||||||||||||||||||||||||||||||||||||||||||||||||
| Network*for coexpressed genes |
|
||||||||||||||||||||||||||||||||||||||||||||||||||||||
|---|---|---|---|---|---|---|---|---|---|---|---|---|---|---|---|---|---|---|---|---|---|---|---|---|---|---|---|---|---|---|---|---|---|---|---|---|---|---|---|---|---|---|---|---|---|---|---|---|---|---|---|---|---|---|---|
| Coexpressed gene list |
[Coexpressed gene list for IBR3] | ||||||||||||||||||||||||||||||||||||||||||||||||||||||
| Gene expression | |||||||||||||||||||||||||||||||||||||||||||||||||||||||
| All samples | [Expression pattern for all samples] | ||||||||||||||||||||||||||||||||||||||||||||||||||||||
| AtGenExpress* (Development) |
258525_at
X axis is samples (pdf file), and Y axis is log2-expression. |
||||||||||||||||||||||||||||||||||||||||||||||||||||||
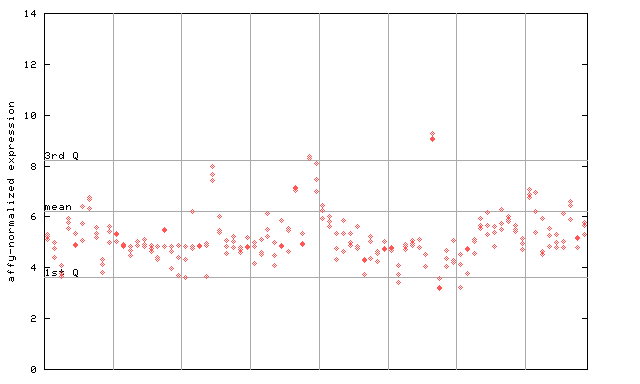
| AtGenExpress* (Stress) |
258525_at
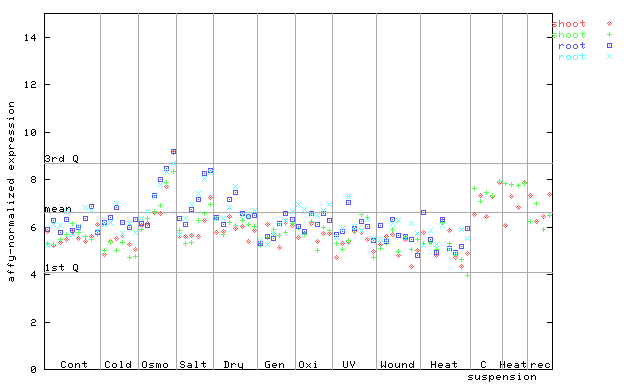
X axis is samples (pdf file), and Y axis is log2-expression. |
||||||||||||||||||||||||||||||||||||||||||||||||||||||
| AtGenExpress* (Hormone) |
258525_at
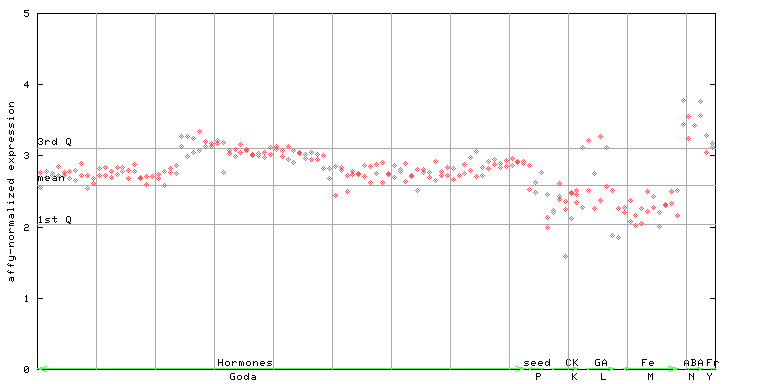
X axis is samples (xls file), and Y axis is log-expression. |
||||||||||||||||||||||||||||||||||||||||||||||||||||||


")
")
")
")
")
| Link to other DBs | ||
| Entrez Gene ID | 819865 |
|
| Refseq ID (protein) | NP_187337.2 | |
The preparation time of this page was 0.2 [sec].