[←][→] ath
| functional annotation | |||||||||||||||||||||||||||||||||||||||||||
| Function | Pectinacetylesterase family protein |


|
|||||||||||||||||||||||||||||||||||||||||
| GO BP |
|
||||||||||||||||||||||||||||||||||||||||||
| GO CC |
|
||||||||||||||||||||||||||||||||||||||||||
| GO MF |
|
||||||||||||||||||||||||||||||||||||||||||
| KEGG | |||||||||||||||||||||||||||||||||||||||||||
| Protein | NP_187552.3 NP_974267.2 | ||||||||||||||||||||||||||||||||||||||||||
| BLAST | NP_187552.3 NP_974267.2 | ||||||||||||||||||||||||||||||||||||||||||
| Orthologous | [Ortholog page] LOC4324296 (osa) AT3G09405 (ath) LOC9271801 (osa) LOC11405474 (mtr) LOC100244164 (vvi) LOC100274158 (zma) LOC100792819 (gma) LOC101255939 (sly) LOC103652245 (zma) LOC103848109 (bra) LOC103859294 (bra) LOC103870544 (bra) | ||||||||||||||||||||||||||||||||||||||||||
| Subcellular localization wolf |
|
||||||||||||||||||||||||||||||||||||||||||
| Subcellular localization TargetP |
|
||||||||||||||||||||||||||||||||||||||||||
| Gene coexpression | |||||||||||||||||||||||||||||||||||||||||||
| Network*for coexpressed genes |
|
||||||||||||||||||||||||||||||||||||||||||
|---|---|---|---|---|---|---|---|---|---|---|---|---|---|---|---|---|---|---|---|---|---|---|---|---|---|---|---|---|---|---|---|---|---|---|---|---|---|---|---|---|---|---|---|
| Coexpressed gene list |
[Coexpressed gene list for AT3G09410] | ||||||||||||||||||||||||||||||||||||||||||
| Gene expression | |||||||||||||||||||||||||||||||||||||||||||
| All samples | [Expression pattern for all samples] | ||||||||||||||||||||||||||||||||||||||||||
| AtGenExpress* (Development) |
259034_at
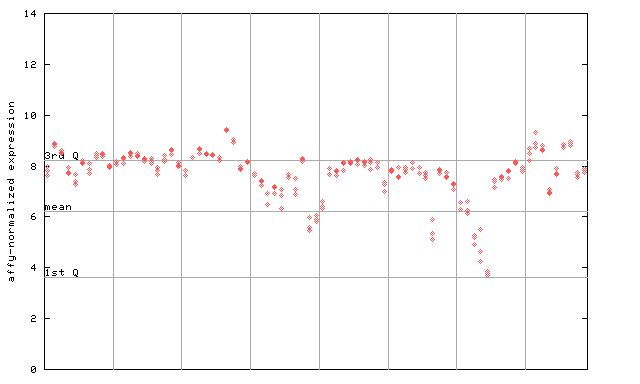
X axis is samples (pdf file), and Y axis is log2-expression. |
||||||||||||||||||||||||||||||||||||||||||
| AtGenExpress* (Stress) |
259034_at
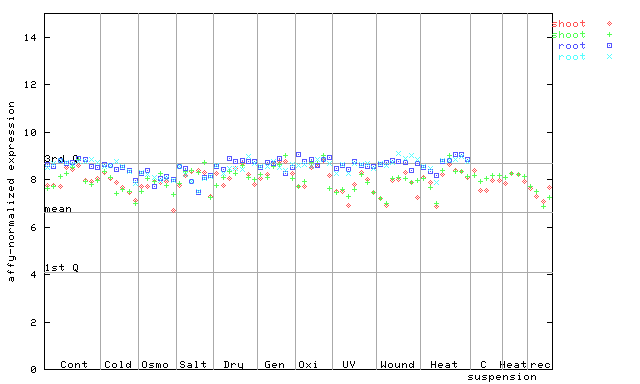
X axis is samples (pdf file), and Y axis is log2-expression. |
||||||||||||||||||||||||||||||||||||||||||
| AtGenExpress* (Hormone) |
259034_at
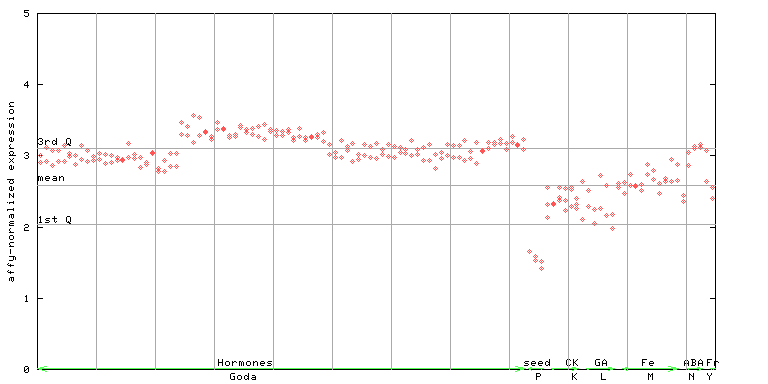
X axis is samples (xls file), and Y axis is log-expression. |
||||||||||||||||||||||||||||||||||||||||||


")
")
| Link to other DBs | ||
| Entrez Gene ID | 820100 |
|
| Refseq ID (protein) | NP_187552.3 | |
| NP_974267.2 | |
|
The preparation time of this page was 0.2 [sec].