[←][→] ath
| functional annotation | ||||||||||||||||||||||||||||||||||||||||||||
| Function | P-loop containing nucleoside triphosphate hydrolases superfamily protein |


|
||||||||||||||||||||||||||||||||||||||||||
| GO BP |
|
|||||||||||||||||||||||||||||||||||||||||||
| GO CC |
|
|||||||||||||||||||||||||||||||||||||||||||
| GO MF |
|
|||||||||||||||||||||||||||||||||||||||||||
| KEGG | ||||||||||||||||||||||||||||||||||||||||||||
| Protein | NP_001189855.1 NP_187646.2 | |||||||||||||||||||||||||||||||||||||||||||
| BLAST | NP_001189855.1 NP_187646.2 | |||||||||||||||||||||||||||||||||||||||||||
| Orthologous | [Ortholog page] LOC4330712 (osa) LOC7468428 (ppo) LOC7494944 (ppo) LOC11410513 (mtr) LOC100811603 (gma) LOC100819315 (gma) LOC101255085 (sly) LOC101267482 (sly) LOC103847629 (bra) LOC103870474 (bra) LOC123128381 (tae) LOC123138238 (tae) LOC123145496 (tae) LOC123403415 (hvu) | |||||||||||||||||||||||||||||||||||||||||||
| Subcellular localization wolf |
|
|||||||||||||||||||||||||||||||||||||||||||
| Subcellular localization TargetP |
|
|||||||||||||||||||||||||||||||||||||||||||
| Gene coexpression | ||||||||||||||||||||||||||||||||||||||||||||
| Network*for coexpressed genes |
|
|||||||||||||||||||||||||||||||||||||||||||
|---|---|---|---|---|---|---|---|---|---|---|---|---|---|---|---|---|---|---|---|---|---|---|---|---|---|---|---|---|---|---|---|---|---|---|---|---|---|---|---|---|---|---|---|---|
| Coexpressed gene list |
[Coexpressed gene list for AT3G10350] | |||||||||||||||||||||||||||||||||||||||||||
| Gene expression | ||||||||||||||||||||||||||||||||||||||||||||
| All samples | [Expression pattern for all samples] | |||||||||||||||||||||||||||||||||||||||||||
| AtGenExpress* (Development) |
259148_at
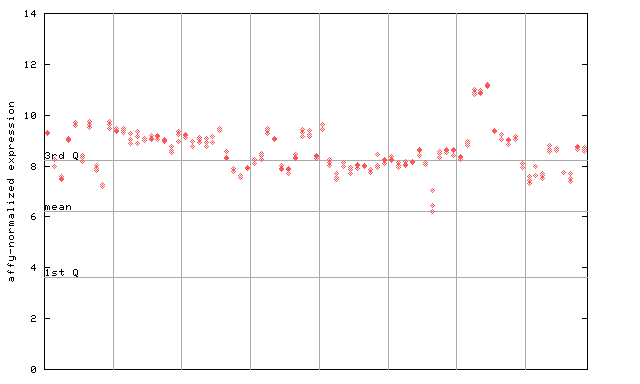
X axis is samples (pdf file), and Y axis is log2-expression. |
|||||||||||||||||||||||||||||||||||||||||||
| AtGenExpress* (Stress) |
259148_at
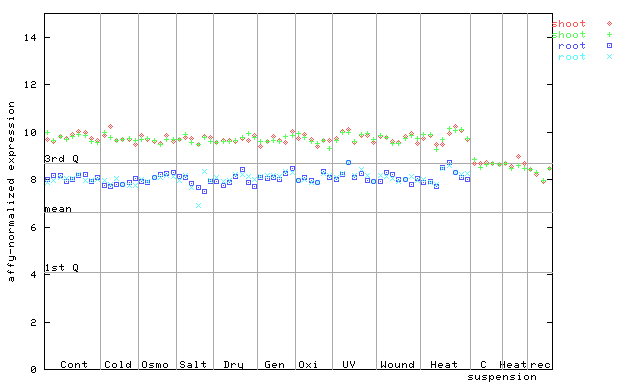
X axis is samples (pdf file), and Y axis is log2-expression. |
|||||||||||||||||||||||||||||||||||||||||||
| AtGenExpress* (Hormone) |
259148_at
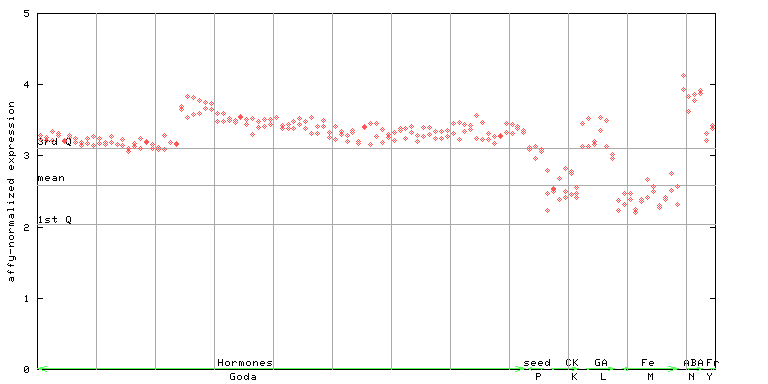
X axis is samples (xls file), and Y axis is log-expression. |
|||||||||||||||||||||||||||||||||||||||||||


")
| Link to other DBs | ||
| Entrez Gene ID | 820197 |
|
| Refseq ID (protein) | NP_001189855.1 | |
| NP_187646.2 | |
|
The preparation time of this page was 0.3 [sec].