[←][→] ath
| functional annotation | ||||||||||||||
| Function | Glycosyl hydrolase superfamily protein |


|
||||||||||||
| GO BP |
|
|||||||||||||
| GO CC |
|
|||||||||||||
| GO MF |
|
|||||||||||||
| KEGG | ath00051 [list] [network] Fructose and mannose metabolism (63 genes) |  |
||||||||||||
| Protein | NP_187700.1 | |||||||||||||
| BLAST | NP_187700.1 | |||||||||||||
| Orthologous | [Ortholog page] AT3G10900 (ath) LOC103847249 (bra) | |||||||||||||
| Subcellular localization wolf |
|
|||||||||||||
| Subcellular localization TargetP |
|
|||||||||||||
| Gene coexpression | ||||||||||||||
| Network*for coexpressed genes |
||||||||||||||
|---|---|---|---|---|---|---|---|---|---|---|---|---|---|---|
| Coexpressed gene list |
[Coexpressed gene list for AT3G10890] | |||||||||||||
| Gene expression | ||||||||||||||
| All samples | [Expression pattern for all samples] | |||||||||||||
| AtGenExpress* (Development) |
258767_at
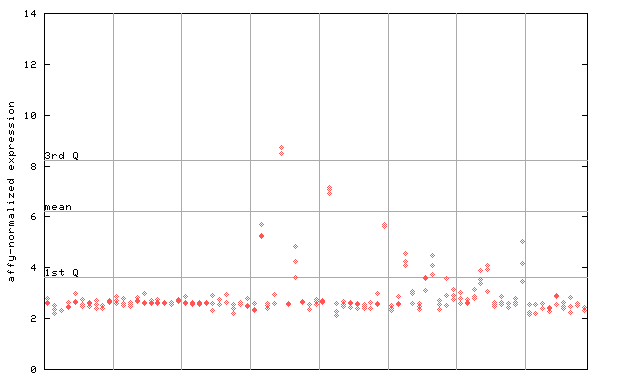
X axis is samples (pdf file), and Y axis is log2-expression. |
|||||||||||||
| AtGenExpress* (Stress) |
258767_at
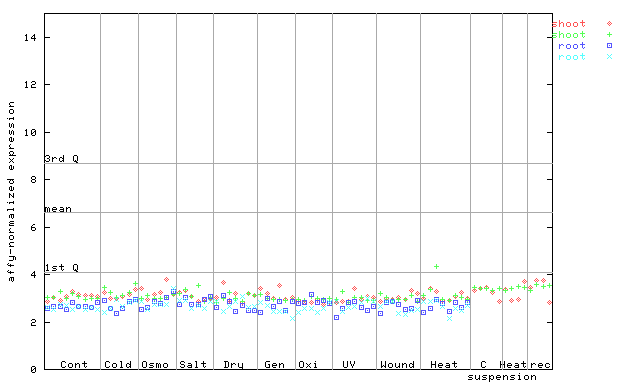
X axis is samples (pdf file), and Y axis is log2-expression. |
|||||||||||||
| AtGenExpress* (Hormone) |
258767_at
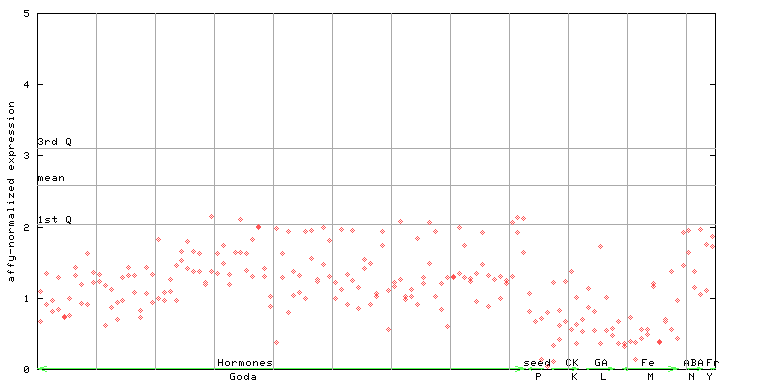
X axis is samples (xls file), and Y axis is log-expression. |
|||||||||||||

| Link to other DBs | ||
| Entrez Gene ID | 820259 |
|
| Refseq ID (protein) | NP_187700.1 | |
The preparation time of this page was 0.1 [sec].