[←][→] ath
| functional annotation | |||||||||||||||||||||||||||||||
| Function | Adenine nucleotide alpha hydrolases-like superfamily protein |


|
|||||||||||||||||||||||||||||
| GO BP |
|
||||||||||||||||||||||||||||||
| GO CC |
|
||||||||||||||||||||||||||||||
| GO MF |
|
||||||||||||||||||||||||||||||
| KEGG | |||||||||||||||||||||||||||||||
| Protein | NP_001030675.1 NP_566406.1 NP_850562.1 NP_850563.1 | ||||||||||||||||||||||||||||||
| BLAST | NP_001030675.1 NP_566406.1 NP_850562.1 NP_850563.1 | ||||||||||||||||||||||||||||||
| Orthologous | [Ortholog page] AT3G58450 (ath) LOC4334119 (osa) LOC4348710 (osa) LOC25483600 (mtr) LOC25483602 (mtr) LOC100254700 (vvi) LOC100285281 (zma) LOC100804300 (gma) USP (sly) LOC103830161 (bra) LOC103841722 (bra) LOC103845875 (bra) LOC103859417 (bra) LOC103870298 (bra) | ||||||||||||||||||||||||||||||
| Subcellular localization wolf |
|
||||||||||||||||||||||||||||||
| Subcellular localization TargetP |
|
||||||||||||||||||||||||||||||
| Gene coexpression | |||||||||||||||||||||||||||||||
| Network*for coexpressed genes |
|
||||||||||||||||||||||||||||||
|---|---|---|---|---|---|---|---|---|---|---|---|---|---|---|---|---|---|---|---|---|---|---|---|---|---|---|---|---|---|---|---|
| Coexpressed gene list |
[Coexpressed gene list for AT3G11930] | ||||||||||||||||||||||||||||||
| Gene expression | |||||||||||||||||||||||||||||||
| All samples | [Expression pattern for all samples] | ||||||||||||||||||||||||||||||
| AtGenExpress* (Development) |
258727_at
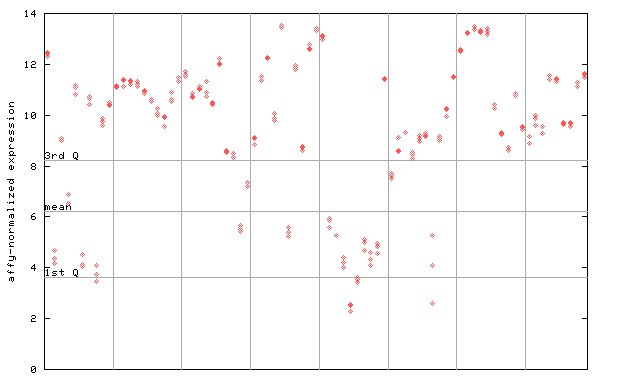
X axis is samples (pdf file), and Y axis is log2-expression. |
||||||||||||||||||||||||||||||
| AtGenExpress* (Stress) |
258727_at
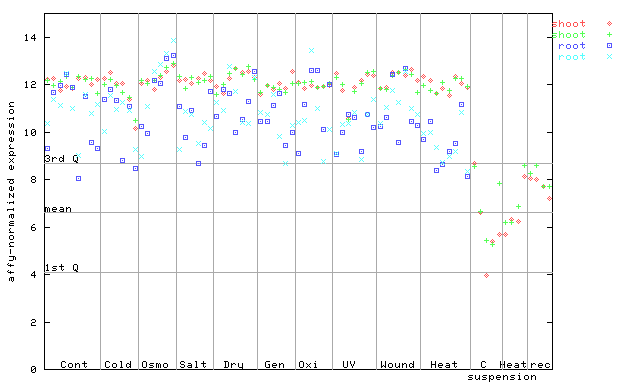
X axis is samples (pdf file), and Y axis is log2-expression. |
||||||||||||||||||||||||||||||
| AtGenExpress* (Hormone) |
258727_at
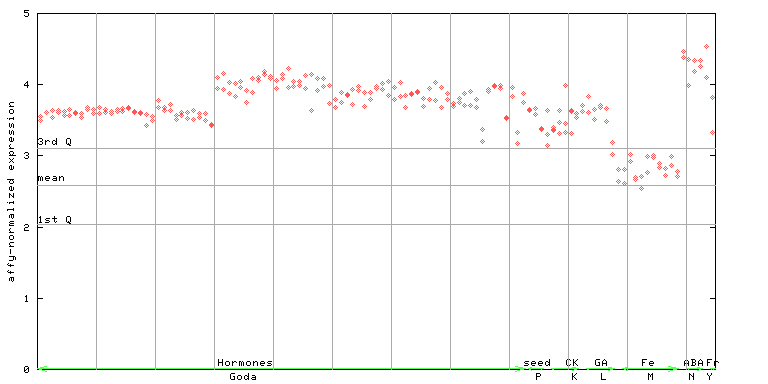
X axis is samples (xls file), and Y axis is log-expression. |
||||||||||||||||||||||||||||||


| Link to other DBs | ||
| Entrez Gene ID | 820366 |
|
| Refseq ID (protein) | NP_001030675.1 | |
| NP_566406.1 | |
|
| NP_850562.1 | |
|
| NP_850563.1 | |
|
The preparation time of this page was 0.2 [sec].