[←][→] ath
| functional annotation | ||||||||||||||||||
| Function | uncharacterized protein |


|
||||||||||||||||
| GO BP |
|
|||||||||||||||||
| GO CC |
|
|||||||||||||||||
| GO MF |
|
|||||||||||||||||
| KEGG | ||||||||||||||||||
| Protein | NP_187920.1 | |||||||||||||||||
| BLAST | NP_187920.1 | |||||||||||||||||
| Orthologous | [Ortholog page] LOC7474084 (ppo) LOC7487537 (ppo) LOC11438882 (mtr) LOC25486247 (mtr) LOC25489140 (mtr) LOC100776851 (gma) LOC100781789 (gma) LOC100784335 (gma) LOC100801579 (gma) LOC102666654 (gma) LOC102669616 (gma) LOC103859501 (bra) LOC103870193 (bra) LOC104648547 (sly) | |||||||||||||||||
| Subcellular localization wolf |
|
|||||||||||||||||
| Subcellular localization TargetP |
|
|||||||||||||||||
| Gene coexpression | ||||||||||||||||||
| Network*for coexpressed genes |
||||||||||||||||||
|---|---|---|---|---|---|---|---|---|---|---|---|---|---|---|---|---|---|---|
| Coexpressed gene list |
[Coexpressed gene list for AT3G13130] | |||||||||||||||||
| Gene expression | ||||||||||||||||||
| All samples | [Expression pattern for all samples] | |||||||||||||||||
| AtGenExpress* (Development) |
257186_at

X axis is samples (pdf file), and Y axis is log2-expression. |
|||||||||||||||||
| AtGenExpress* (Stress) |
257186_at
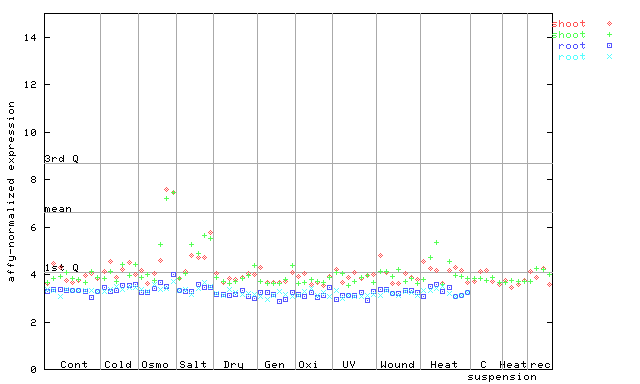
X axis is samples (pdf file), and Y axis is log2-expression. |
|||||||||||||||||
| AtGenExpress* (Hormone) |
257186_at
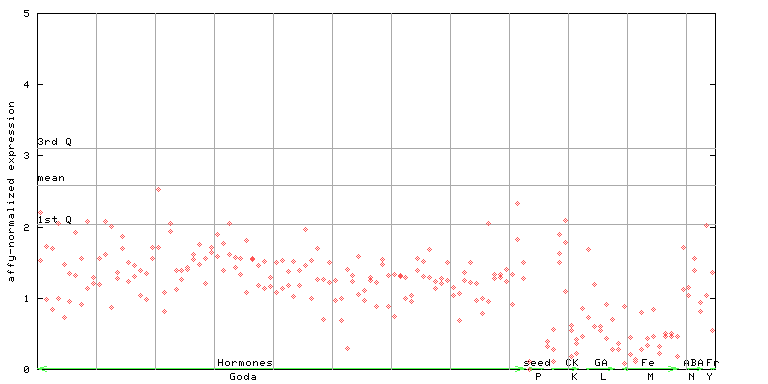
X axis is samples (xls file), and Y axis is log-expression. |
|||||||||||||||||

| Link to other DBs | ||
| Entrez Gene ID | 820501 |
|
| Refseq ID (protein) | NP_187920.1 | |
The preparation time of this page was 0.1 [sec].