[←][→] ath
| functional annotation | ||||||||||||||||||||||||||
| Function | hypothetical protein |


|
||||||||||||||||||||||||
| GO BP |
|
|||||||||||||||||||||||||
| GO CC |
|
|||||||||||||||||||||||||
| GO MF |
|
|||||||||||||||||||||||||
| KEGG | ||||||||||||||||||||||||||
| Protein | NP_566472.1 | |||||||||||||||||||||||||
| BLAST | NP_566472.1 | |||||||||||||||||||||||||
| Orthologous | [Ortholog page] AT1G54120 (ath) LOC4330917 (osa) LOC25500554 (mtr) LOC100246433 (vvi) LOC100278778 (zma) LOC102663438 (gma) LOC102670094 (gma) LOC103832632 (bra) LOC103842334 (bra) LOC103871072 (bra) LOC104648074 (sly) | |||||||||||||||||||||||||
| Subcellular localization wolf |
|
|||||||||||||||||||||||||
| Subcellular localization TargetP |
|
|||||||||||||||||||||||||
| Gene coexpression | ||||||||||||||||||||||||||
| Network*for coexpressed genes |
|
|||||||||||||||||||||||||
|---|---|---|---|---|---|---|---|---|---|---|---|---|---|---|---|---|---|---|---|---|---|---|---|---|---|---|
| Coexpressed gene list |
[Coexpressed gene list for AT3G14060] | |||||||||||||||||||||||||
| Gene expression | ||||||||||||||||||||||||||
| All samples | [Expression pattern for all samples] | |||||||||||||||||||||||||
| AtGenExpress* (Development) |
258209_at
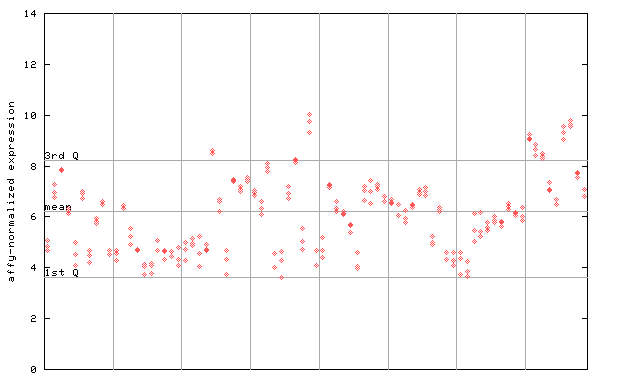
X axis is samples (pdf file), and Y axis is log2-expression. |
|||||||||||||||||||||||||
| AtGenExpress* (Stress) |
258209_at
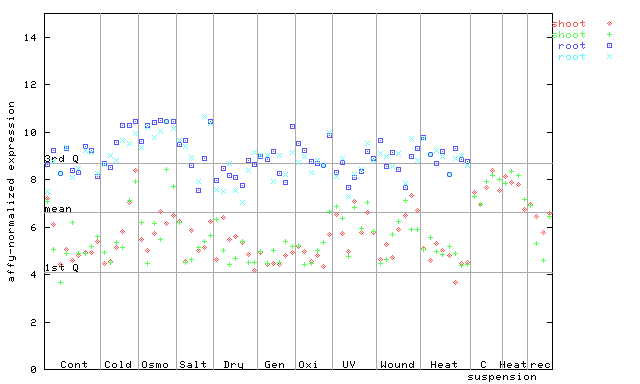
X axis is samples (pdf file), and Y axis is log2-expression. |
|||||||||||||||||||||||||
| AtGenExpress* (Hormone) |
258209_at
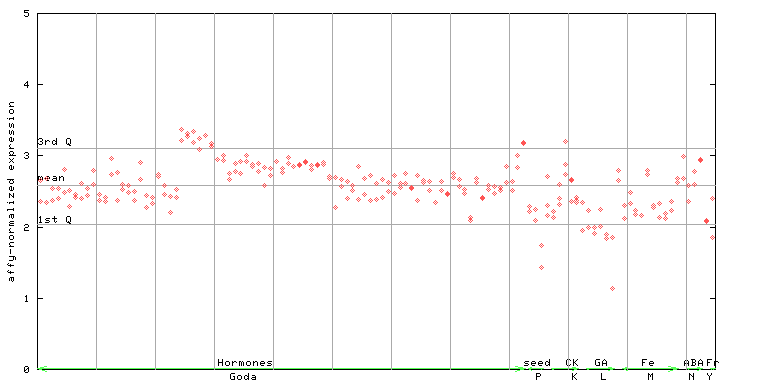
X axis is samples (xls file), and Y axis is log-expression. |
|||||||||||||||||||||||||


| Link to other DBs | ||
| Entrez Gene ID | 820620 |
|
| Refseq ID (protein) | NP_566472.1 | |
The preparation time of this page was 0.2 [sec].