[←][→] ath
| functional annotation | ||||||||||||||||||||||||||||||||||||||||||||||||||
| Function | TRICHOME BIREFRINGENCE-LIKE 41 |

 Plant GARDEN Plant GARDEN JBrowse
|
||||||||||||||||||||||||||||||||||||||||||||||||
| GO BP |
|
|||||||||||||||||||||||||||||||||||||||||||||||||
| GO CC |
|
|||||||||||||||||||||||||||||||||||||||||||||||||
| GO MF |
|
|||||||||||||||||||||||||||||||||||||||||||||||||
| KEGG | ||||||||||||||||||||||||||||||||||||||||||||||||||
| Protein | NP_188103.2 NP_974314.2 | |||||||||||||||||||||||||||||||||||||||||||||||||
| BLAST | NP_188103.2 NP_974314.2 | |||||||||||||||||||||||||||||||||||||||||||||||||
| Orthologous | [Ortholog page] LOC7472332 (ppo) LOC25487209 (mtr) LOC100794317 (gma) LOC100817531 (gma) LOC101244059 (sly) LOC101247637 (sly) LOC103841769 (bra) LOC103859594 (bra) LOC103869978 (bra) LOC103869985 (bra) | |||||||||||||||||||||||||||||||||||||||||||||||||
| Subcellular localization wolf |
|
|||||||||||||||||||||||||||||||||||||||||||||||||
| Subcellular localization TargetP |
|
|||||||||||||||||||||||||||||||||||||||||||||||||
| Gene coexpression | ||||||||||||||||||||||||||||||||||||||||||||||||||
| Network*for coexpressed genes |
|
|||||||||||||||||||||||||||||||||||||||||||||||||
|---|---|---|---|---|---|---|---|---|---|---|---|---|---|---|---|---|---|---|---|---|---|---|---|---|---|---|---|---|---|---|---|---|---|---|---|---|---|---|---|---|---|---|---|---|---|---|---|---|---|---|
| Coexpressed gene list |
[Coexpressed gene list for TBL41] | |||||||||||||||||||||||||||||||||||||||||||||||||
| Gene expression | ||||||||||||||||||||||||||||||||||||||||||||||||||
| All samples | [Expression pattern for all samples] | |||||||||||||||||||||||||||||||||||||||||||||||||
| AtGenExpress* (Development) |
256600_at
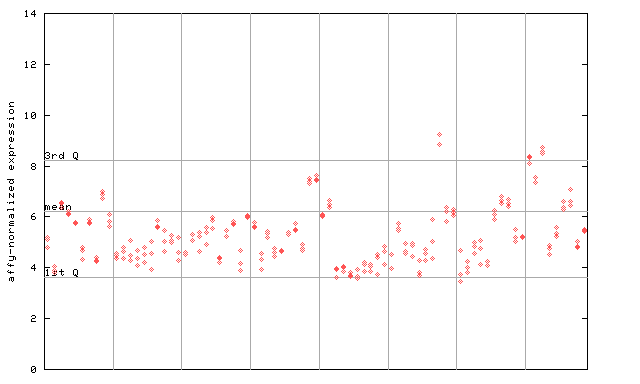
X axis is samples (pdf file), and Y axis is log2-expression. |
|||||||||||||||||||||||||||||||||||||||||||||||||
| AtGenExpress* (Stress) |
256600_at
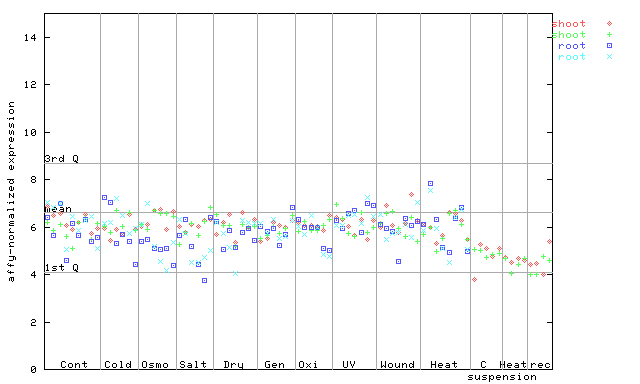
X axis is samples (pdf file), and Y axis is log2-expression. |
|||||||||||||||||||||||||||||||||||||||||||||||||
| AtGenExpress* (Hormone) |
256600_at
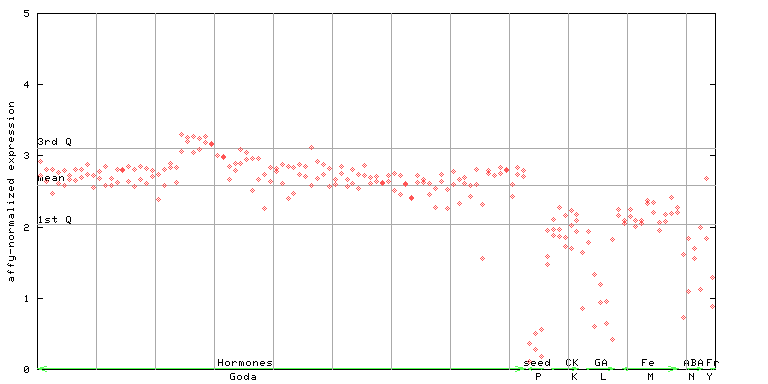
X axis is samples (xls file), and Y axis is log-expression. |
|||||||||||||||||||||||||||||||||||||||||||||||||


")
")
")
")
")
| Link to other DBs | ||
| Entrez Gene ID | 820714 |
|
| Refseq ID (protein) | NP_188103.2 | |
| NP_974314.2 | |
|
The preparation time of this page was 0.5 [sec].