[←][→] ath
| functional annotation | |||||||||||||||||||||||||||||||||||||||||||||||||
| Function | chloroplast 30S ribosomal protein S20 |


|
|||||||||||||||||||||||||||||||||||||||||||||||
| GO BP |
|
||||||||||||||||||||||||||||||||||||||||||||||||
| GO CC |
|
||||||||||||||||||||||||||||||||||||||||||||||||
| GO MF |
|
||||||||||||||||||||||||||||||||||||||||||||||||
| KEGG | ath03010 [list] [network] Ribosome (356 genes) |  |
|||||||||||||||||||||||||||||||||||||||||||||||
| Protein | NP_188137.1 | ||||||||||||||||||||||||||||||||||||||||||||||||
| BLAST | NP_188137.1 | ||||||||||||||||||||||||||||||||||||||||||||||||
| Orthologous | [Ortholog page] LOC4325273 (osa) LOC11413544 (mtr) LOC100265925 (vvi) LOC100286220 (zma) LOC100499656 (gma) LOC100786192 (gma) LOC101261139 (sly) LOC103841657 (bra) LOC103859614 (bra) LOC103869949 (bra) | ||||||||||||||||||||||||||||||||||||||||||||||||
| Subcellular localization wolf |
|
||||||||||||||||||||||||||||||||||||||||||||||||
| Subcellular localization TargetP |
|
||||||||||||||||||||||||||||||||||||||||||||||||
| Gene coexpression | |||||||||||||||||||||||||||||||||||||||||||||||||
| Network*for coexpressed genes |
|
||||||||||||||||||||||||||||||||||||||||||||||||
|---|---|---|---|---|---|---|---|---|---|---|---|---|---|---|---|---|---|---|---|---|---|---|---|---|---|---|---|---|---|---|---|---|---|---|---|---|---|---|---|---|---|---|---|---|---|---|---|---|---|
| Coexpressed gene list |
[Coexpressed gene list for PRPS20] | ||||||||||||||||||||||||||||||||||||||||||||||||
| Gene expression | |||||||||||||||||||||||||||||||||||||||||||||||||
| All samples | [Expression pattern for all samples] | ||||||||||||||||||||||||||||||||||||||||||||||||
| AtGenExpress* (Development) |
256855_at
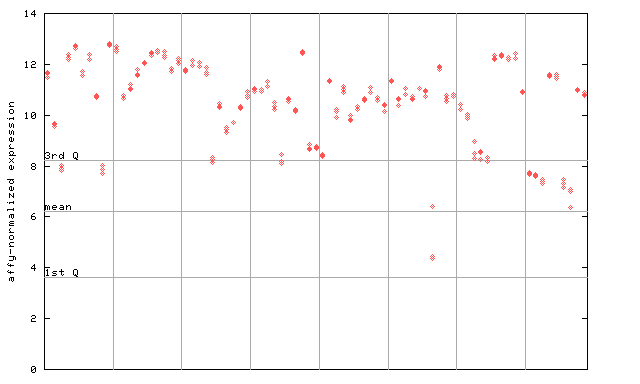
X axis is samples (pdf file), and Y axis is log2-expression. |
||||||||||||||||||||||||||||||||||||||||||||||||
| AtGenExpress* (Stress) |
256855_at
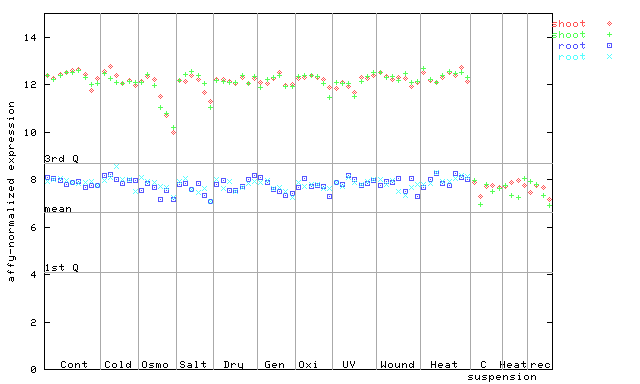
X axis is samples (pdf file), and Y axis is log2-expression. |
||||||||||||||||||||||||||||||||||||||||||||||||
| AtGenExpress* (Hormone) |
256855_at
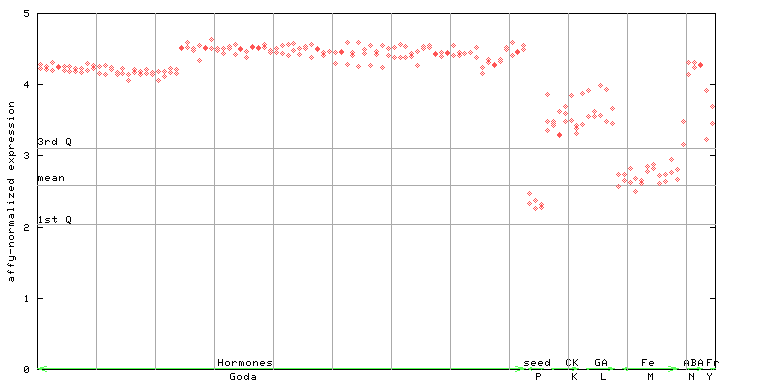
X axis is samples (xls file), and Y axis is log-expression. |
||||||||||||||||||||||||||||||||||||||||||||||||


")
| Link to other DBs | ||
| Entrez Gene ID | 820750 |
|
| Refseq ID (protein) | NP_188137.1 | |
The preparation time of this page was 0.1 [sec].