[←][→] ath
| functional annotation | |||||||||||||||||||||||||||||||||||||||||||||||||||||||
| Function | glutaredoxin 4 |


|
|||||||||||||||||||||||||||||||||||||||||||||||||||||
| GO BP |
|
||||||||||||||||||||||||||||||||||||||||||||||||||||||
| GO CC |
|
||||||||||||||||||||||||||||||||||||||||||||||||||||||
| GO MF |
|
||||||||||||||||||||||||||||||||||||||||||||||||||||||
| KEGG | |||||||||||||||||||||||||||||||||||||||||||||||||||||||
| Protein | NP_001030704.1 NP_566522.1 | ||||||||||||||||||||||||||||||||||||||||||||||||||||||
| BLAST | NP_001030704.1 NP_566522.1 | ||||||||||||||||||||||||||||||||||||||||||||||||||||||
| Orthologous | [Ortholog page] LOC4327130 (osa) LOC4327794 (osa) LOC7478367 (ppo) LOC11433073 (mtr) LOC100306093 (gma) LOC100500103 (gma) LOC100527610 (gma) LOC101266646 (sly) LOC103840599 (bra) LOC103869892 (bra) LOC123060529 (tae) LOC123069089 (tae) LOC123077608 (tae) LOC123443036 (hvu) | ||||||||||||||||||||||||||||||||||||||||||||||||||||||
| Subcellular localization wolf |
|
||||||||||||||||||||||||||||||||||||||||||||||||||||||
| Subcellular localization TargetP |
|
||||||||||||||||||||||||||||||||||||||||||||||||||||||
| Gene coexpression | |||||||||||||||||||||||||||||||||||||||||||||||||||||||
| Network*for coexpressed genes |
|
||||||||||||||||||||||||||||||||||||||||||||||||||||||
|---|---|---|---|---|---|---|---|---|---|---|---|---|---|---|---|---|---|---|---|---|---|---|---|---|---|---|---|---|---|---|---|---|---|---|---|---|---|---|---|---|---|---|---|---|---|---|---|---|---|---|---|---|---|---|---|
| Coexpressed gene list |
[Coexpressed gene list for GRX4] | ||||||||||||||||||||||||||||||||||||||||||||||||||||||
| Gene expression | |||||||||||||||||||||||||||||||||||||||||||||||||||||||
| All samples | [Expression pattern for all samples] | ||||||||||||||||||||||||||||||||||||||||||||||||||||||
| AtGenExpress* (Development) |
258273_at
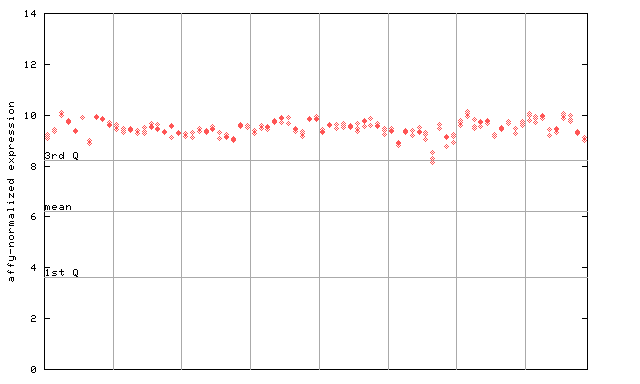
X axis is samples (pdf file), and Y axis is log2-expression. |
||||||||||||||||||||||||||||||||||||||||||||||||||||||
| AtGenExpress* (Stress) |
258273_at
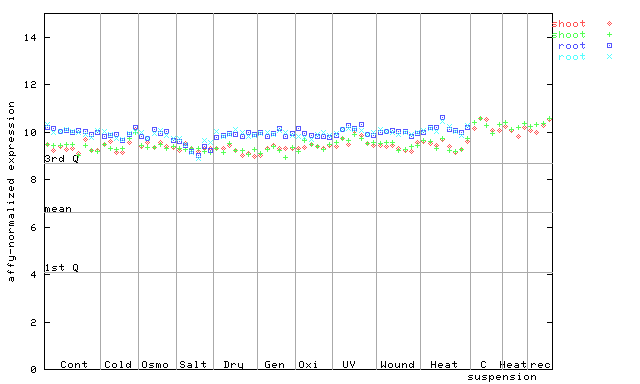
X axis is samples (pdf file), and Y axis is log2-expression. |
||||||||||||||||||||||||||||||||||||||||||||||||||||||
| AtGenExpress* (Hormone) |
258273_at
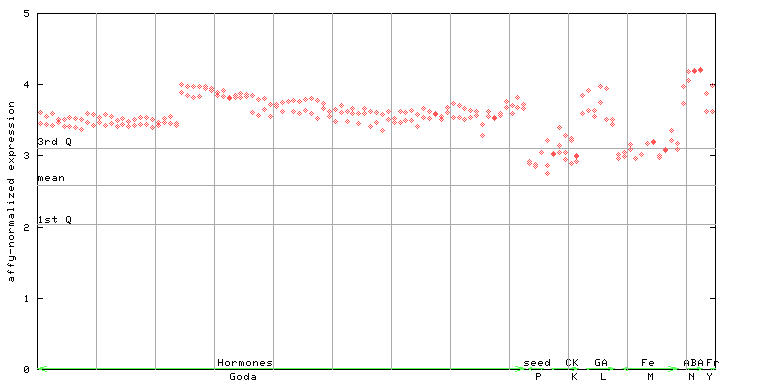
X axis is samples (xls file), and Y axis is log-expression. |
||||||||||||||||||||||||||||||||||||||||||||||||||||||


")
")
")
")
")
| Link to other DBs | ||
| Entrez Gene ID | 820809 |
|
| Refseq ID (protein) | NP_001030704.1 | |
| NP_566522.1 | |
|
The preparation time of this page was 0.1 [sec].