[←][→] ath
| functional annotation | ||||||||||||||||||||||||||||||||||||||
| Function | Homeodomain-like superfamily protein |


|
||||||||||||||||||||||||||||||||||||
| GO BP |
|
|||||||||||||||||||||||||||||||||||||
| GO CC |
|
|||||||||||||||||||||||||||||||||||||
| GO MF |
|
|||||||||||||||||||||||||||||||||||||
| KEGG | ||||||||||||||||||||||||||||||||||||||
| Protein | NP_188256.1 | |||||||||||||||||||||||||||||||||||||
| BLAST | NP_188256.1 | |||||||||||||||||||||||||||||||||||||
| Orthologous | [Ortholog page] MYB52 (gma) MYB62 (gma) LOC4326766 (osa) LOC7470580 (ppo) LOC11430671 (mtr) LOC100241227 (vvi) LOC100256666 (vvi) LOC100283600 (zma) LOC101248552 (sly) LOC103860178 (bra) LOC103869829 (bra) | |||||||||||||||||||||||||||||||||||||
| Subcellular localization wolf |
|
|||||||||||||||||||||||||||||||||||||
| Subcellular localization TargetP |
|
|||||||||||||||||||||||||||||||||||||
| Gene coexpression | ||||||||||||||||||||||||||||||||||||||
| Network*for coexpressed genes |
|
|||||||||||||||||||||||||||||||||||||
|---|---|---|---|---|---|---|---|---|---|---|---|---|---|---|---|---|---|---|---|---|---|---|---|---|---|---|---|---|---|---|---|---|---|---|---|---|---|---|
| Coexpressed gene list |
[Coexpressed gene list for AT3G16350] | |||||||||||||||||||||||||||||||||||||
| Gene expression | ||||||||||||||||||||||||||||||||||||||
| All samples | [Expression pattern for all samples] | |||||||||||||||||||||||||||||||||||||
| AtGenExpress* (Development) |
259379_at
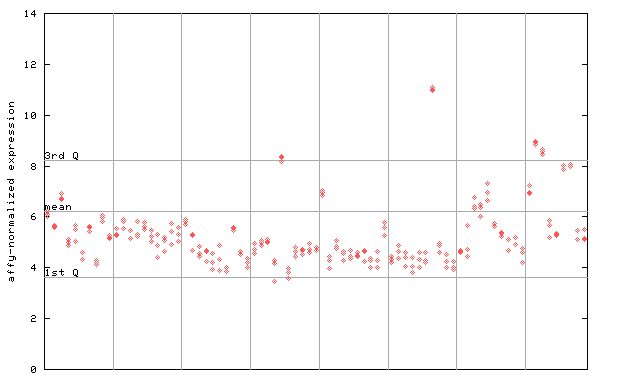
X axis is samples (pdf file), and Y axis is log2-expression. |
|||||||||||||||||||||||||||||||||||||
| AtGenExpress* (Stress) |
259379_at
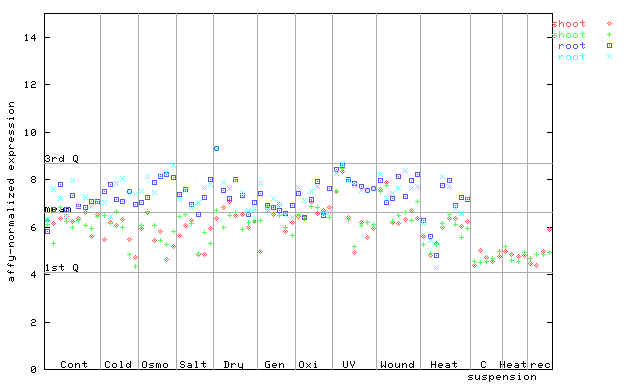
X axis is samples (pdf file), and Y axis is log2-expression. |
|||||||||||||||||||||||||||||||||||||
| AtGenExpress* (Hormone) |
259379_at
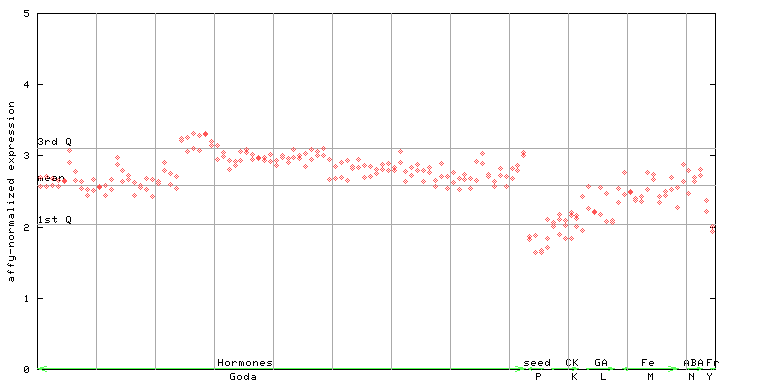
X axis is samples (xls file), and Y axis is log-expression. |
|||||||||||||||||||||||||||||||||||||


")
")
| Link to other DBs | ||
| Entrez Gene ID | 820882 |
|
| Refseq ID (protein) | NP_188256.1 | |
The preparation time of this page was 0.2 [sec].