[←][→] ath
| functional annotation | ||||||||||||||||||||||||||
| Function | Plant invertase/pectin methylesterase inhibitor superfamily protein |


|
||||||||||||||||||||||||
| GO BP |
|
|||||||||||||||||||||||||
| GO CC |
|
|||||||||||||||||||||||||
| GO MF |
|
|||||||||||||||||||||||||
| KEGG | ||||||||||||||||||||||||||
| Protein | NP_188338.1 | |||||||||||||||||||||||||
| BLAST | NP_188338.1 | |||||||||||||||||||||||||
| Orthologous | [Ortholog page] LOC7471097 (ppo) LOC11409052 (mtr) LOC11412477 (mtr) LOC11422901 (mtr) LOC100527840 (gma) LOC100788167 (gma) LOC100791177 (gma) LOC100820305 (gma) LOC103839639 (bra) LOC103859700 (bra) LOC103869712 (bra) | |||||||||||||||||||||||||
| Subcellular localization wolf |
|
|||||||||||||||||||||||||
| Subcellular localization TargetP |
|
|||||||||||||||||||||||||
| Gene coexpression | ||||||||||||||||||||||||||
| Network*for coexpressed genes |
|
|||||||||||||||||||||||||
|---|---|---|---|---|---|---|---|---|---|---|---|---|---|---|---|---|---|---|---|---|---|---|---|---|---|---|
| Coexpressed gene list |
[Coexpressed gene list for AT3G17130] | |||||||||||||||||||||||||
| Gene expression | ||||||||||||||||||||||||||
| All samples | [Expression pattern for all samples] | |||||||||||||||||||||||||
| AtGenExpress* (Development) |
257876_at
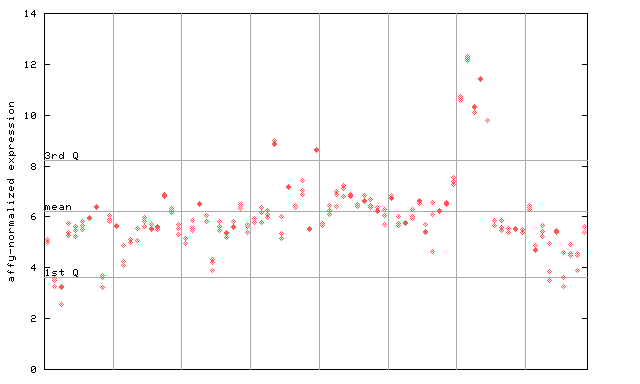
X axis is samples (pdf file), and Y axis is log2-expression. |
|||||||||||||||||||||||||
| AtGenExpress* (Stress) |
257876_at
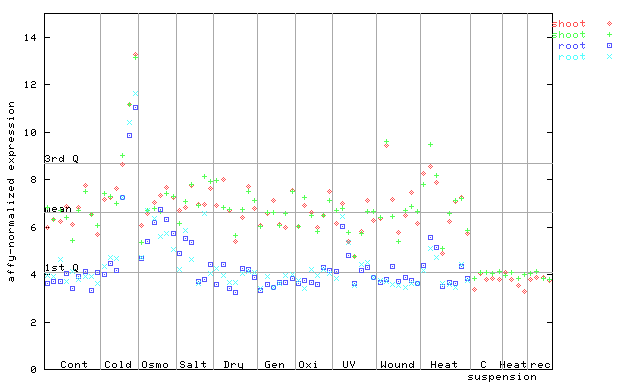
X axis is samples (pdf file), and Y axis is log2-expression. |
|||||||||||||||||||||||||
| AtGenExpress* (Hormone) |
257876_at
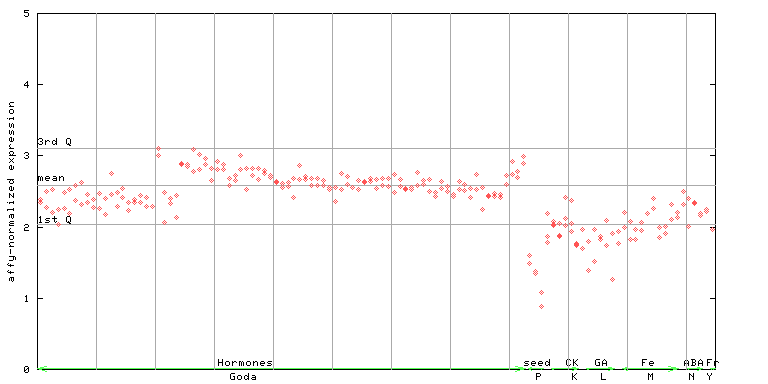
X axis is samples (xls file), and Y axis is log-expression. |
|||||||||||||||||||||||||


| Link to other DBs | ||
| Entrez Gene ID | 820970 |
|
| Refseq ID (protein) | NP_188338.1 | |
The preparation time of this page was 0.2 [sec].