[←][→] ath
| functional annotation | |||||||||||||||||||||||||||||||||||||||||||||||
| Function | NAD(P)-binding Rossmann-fold superfamily protein |


|
|||||||||||||||||||||||||||||||||||||||||||||
| GO BP |
|
||||||||||||||||||||||||||||||||||||||||||||||
| GO CC |
|
||||||||||||||||||||||||||||||||||||||||||||||
| GO MF |
|
||||||||||||||||||||||||||||||||||||||||||||||
| KEGG | |||||||||||||||||||||||||||||||||||||||||||||||
| Protein | NP_188519.2 | ||||||||||||||||||||||||||||||||||||||||||||||
| BLAST | NP_188519.2 | ||||||||||||||||||||||||||||||||||||||||||||||
| Orthologous | [Ortholog page] LOC4347935 (osa) LOC7456397 (ppo) LOC7461193 (ppo) LOC25492706 (mtr) LOC100779056 (gma) LOC100802397 (gma) LOC100802919 (gma) LOC101245302 (sly) LOC103869513 (bra) LOC123104206 (tae) LOC123112454 (tae) LOC123121963 (tae) LOC123399483 (hvu) | ||||||||||||||||||||||||||||||||||||||||||||||
| Subcellular localization wolf |
|
||||||||||||||||||||||||||||||||||||||||||||||
| Subcellular localization TargetP |
|
||||||||||||||||||||||||||||||||||||||||||||||
| Gene coexpression | |||||||||||||||||||||||||||||||||||||||||||||||
| Network*for coexpressed genes |
|
||||||||||||||||||||||||||||||||||||||||||||||
|---|---|---|---|---|---|---|---|---|---|---|---|---|---|---|---|---|---|---|---|---|---|---|---|---|---|---|---|---|---|---|---|---|---|---|---|---|---|---|---|---|---|---|---|---|---|---|---|
| Coexpressed gene list |
[Coexpressed gene list for Tic62] | ||||||||||||||||||||||||||||||||||||||||||||||
| Gene expression | |||||||||||||||||||||||||||||||||||||||||||||||
| All samples | [Expression pattern for all samples] | ||||||||||||||||||||||||||||||||||||||||||||||
| AtGenExpress* (Development) |
256655_at
X axis is samples (pdf file), and Y axis is log2-expression. |
||||||||||||||||||||||||||||||||||||||||||||||
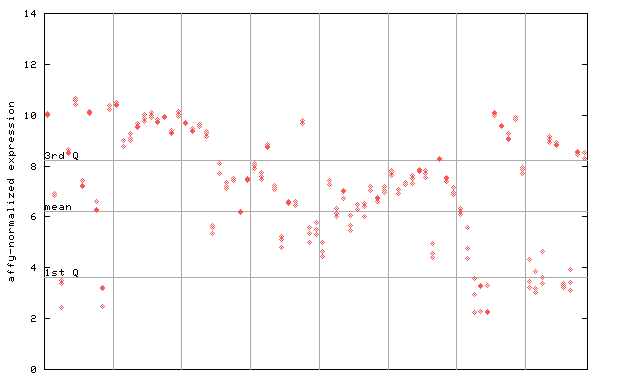
| AtGenExpress* (Stress) |
256655_at
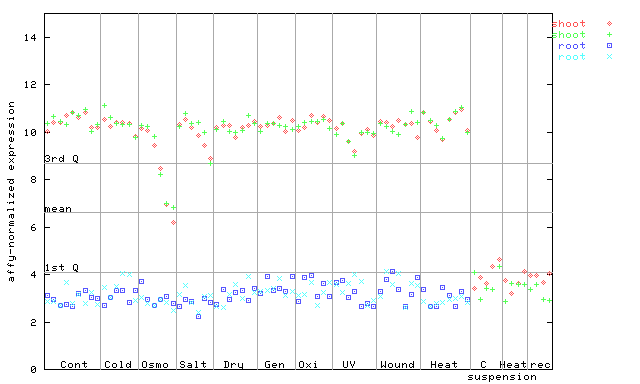
X axis is samples (pdf file), and Y axis is log2-expression. |
||||||||||||||||||||||||||||||||||||||||||||||
| AtGenExpress* (Hormone) |
256655_at
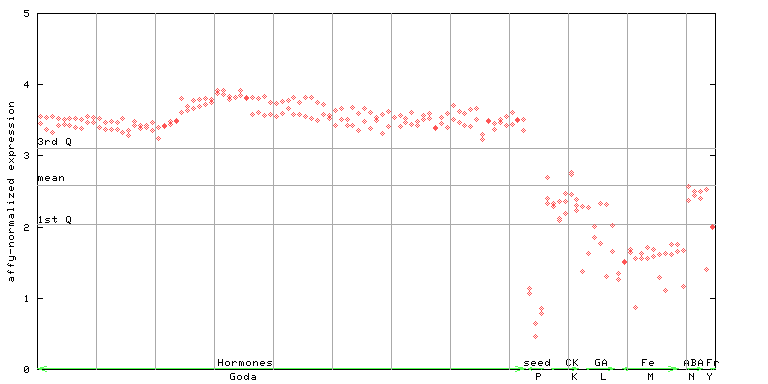
X axis is samples (xls file), and Y axis is log-expression. |
||||||||||||||||||||||||||||||||||||||||||||||


")
")
")
| Link to other DBs | ||
| Entrez Gene ID | 821422 |
|
| Refseq ID (protein) | NP_188519.2 | |
The preparation time of this page was 0.3 [sec].