[←][→] ath
| functional annotation | ||||||||||||||||||||||||||||||||||||||||||||||||
| Function | imidazoleglycerol-phosphate dehydratase |


|
||||||||||||||||||||||||||||||||||||||||||||||
| GO BP |
|
|||||||||||||||||||||||||||||||||||||||||||||||
| GO CC |
|
|||||||||||||||||||||||||||||||||||||||||||||||
| GO MF |
|
|||||||||||||||||||||||||||||||||||||||||||||||
| KEGG | ath00340 [list] [network] Histidine metabolism (19 genes) |  |
||||||||||||||||||||||||||||||||||||||||||||||
| ath01230 [list] [network] Biosynthesis of amino acids (244 genes) | |
|||||||||||||||||||||||||||||||||||||||||||||||
| Protein | NP_850624.1 NP_850625.1 | |||||||||||||||||||||||||||||||||||||||||||||||
| BLAST | NP_850624.1 NP_850625.1 | |||||||||||||||||||||||||||||||||||||||||||||||
| Orthologous | [Ortholog page] LOC543224 (tae) HISN5B (ath) LOC4337007 (osa) LOC7474209 (ppo) LOC18101552 (ppo) LOC25485215 (mtr) LOC100804707 (gma) LOC101253226 (sly) LOC103834546 (bra) LOC103869038 (bra) LOC123046726 (tae) LOC123190436 (tae) LOC123424678 (hvu) LOC123427820 (hvu) | |||||||||||||||||||||||||||||||||||||||||||||||
| Subcellular localization wolf |
|
|||||||||||||||||||||||||||||||||||||||||||||||
| Subcellular localization TargetP |
|
|||||||||||||||||||||||||||||||||||||||||||||||
| Gene coexpression | ||||||||||||||||||||||||||||||||||||||||||||||||
| Network*for coexpressed genes |
|
|||||||||||||||||||||||||||||||||||||||||||||||
|---|---|---|---|---|---|---|---|---|---|---|---|---|---|---|---|---|---|---|---|---|---|---|---|---|---|---|---|---|---|---|---|---|---|---|---|---|---|---|---|---|---|---|---|---|---|---|---|---|
| Coexpressed gene list |
[Coexpressed gene list for IGPD] | |||||||||||||||||||||||||||||||||||||||||||||||
| Gene expression | ||||||||||||||||||||||||||||||||||||||||||||||||
| All samples | [Expression pattern for all samples] | |||||||||||||||||||||||||||||||||||||||||||||||
| AtGenExpress* (Development) |
258457_at
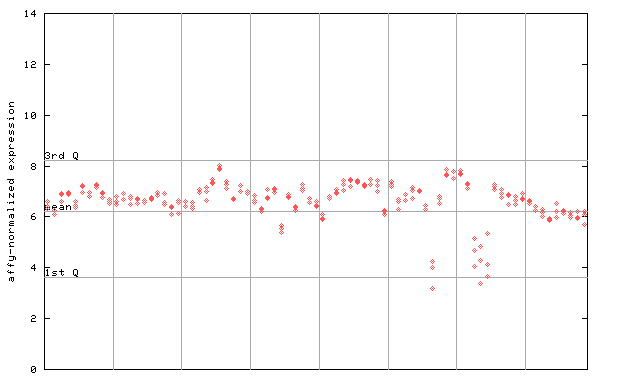
X axis is samples (pdf file), and Y axis is log2-expression. |
|||||||||||||||||||||||||||||||||||||||||||||||
| AtGenExpress* (Stress) |
258457_at
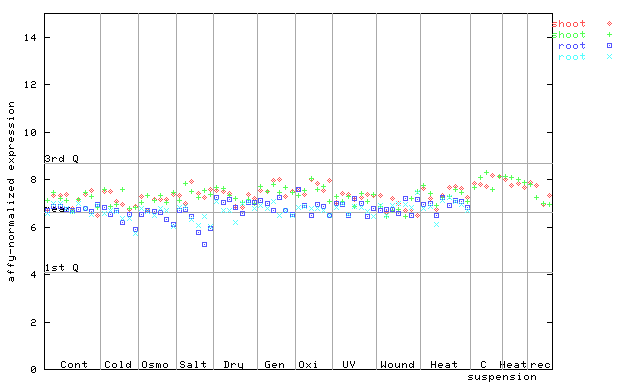
X axis is samples (pdf file), and Y axis is log2-expression. |
|||||||||||||||||||||||||||||||||||||||||||||||
| AtGenExpress* (Hormone) |
258457_at
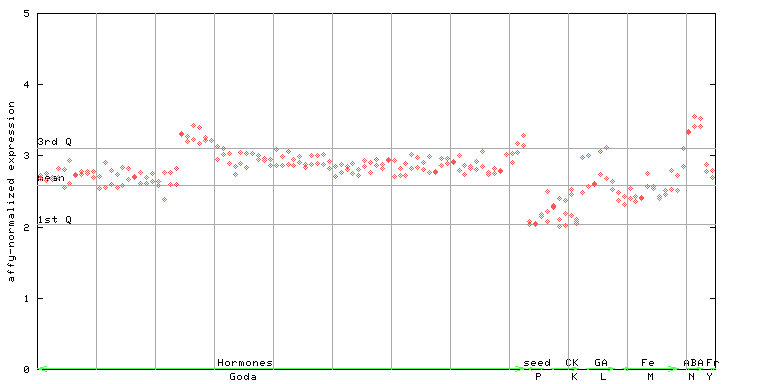
X axis is samples (xls file), and Y axis is log-expression. |
|||||||||||||||||||||||||||||||||||||||||||||||


")
")
| Link to other DBs | ||
| Entrez Gene ID | 821812 |
|
| Refseq ID (protein) | NP_850624.1 | |
| NP_850625.1 | |
|
The preparation time of this page was 0.1 [sec].