[←][→] ath
| functional annotation | ||||||||||||||||||||||||||||||||||||||||||||||||||||||||
| Function | heteroglycan glucosidase 1 |


|
||||||||||||||||||||||||||||||||||||||||||||||||||||||
| GO BP |
|
|||||||||||||||||||||||||||||||||||||||||||||||||||||||
| GO CC |
|
|||||||||||||||||||||||||||||||||||||||||||||||||||||||
| GO MF |
|
|||||||||||||||||||||||||||||||||||||||||||||||||||||||
| KEGG | ||||||||||||||||||||||||||||||||||||||||||||||||||||||||
| Protein | NP_001118685.1 NP_001327915.1 NP_566736.1 | |||||||||||||||||||||||||||||||||||||||||||||||||||||||
| BLAST | NP_001118685.1 NP_001327915.1 NP_566736.1 | |||||||||||||||||||||||||||||||||||||||||||||||||||||||
| Orthologous | [Ortholog page] LOC4343041 (osa) LOC4343045 (osa) LOC11410655 (mtr) LOC18094054 (ppo) LOC100809690 (gma) LOC101249477 (sly) LOC103832252 (bra) LOC103832265 (bra) LOC123053899 (tae) LOC123130738 (tae) LOC123150697 (tae) LOC123181840 (tae) LOC123412340 (hvu) LOC123440019 (hvu) | |||||||||||||||||||||||||||||||||||||||||||||||||||||||
| Subcellular localization wolf |
|
|||||||||||||||||||||||||||||||||||||||||||||||||||||||
| Subcellular localization TargetP |
|
|||||||||||||||||||||||||||||||||||||||||||||||||||||||
| Gene coexpression | ||||||||||||||||||||||||||||||||||||||||||||||||||||||||
| Network*for coexpressed genes |
|
|||||||||||||||||||||||||||||||||||||||||||||||||||||||
|---|---|---|---|---|---|---|---|---|---|---|---|---|---|---|---|---|---|---|---|---|---|---|---|---|---|---|---|---|---|---|---|---|---|---|---|---|---|---|---|---|---|---|---|---|---|---|---|---|---|---|---|---|---|---|---|---|
| Coexpressed gene list |
[Coexpressed gene list for HGL1] | |||||||||||||||||||||||||||||||||||||||||||||||||||||||
| Gene expression | ||||||||||||||||||||||||||||||||||||||||||||||||||||||||
| All samples | [Expression pattern for all samples] | |||||||||||||||||||||||||||||||||||||||||||||||||||||||
| AtGenExpress* (Development) |
258109_at
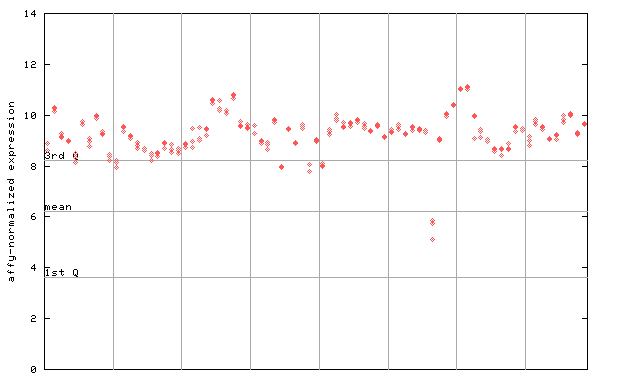
X axis is samples (pdf file), and Y axis is log2-expression. |
|||||||||||||||||||||||||||||||||||||||||||||||||||||||
| AtGenExpress* (Stress) |
258109_at
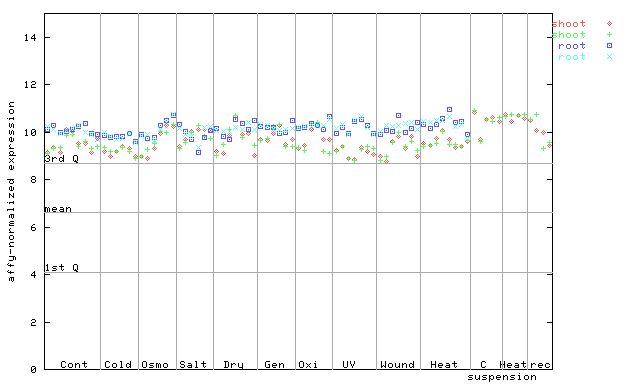
X axis is samples (pdf file), and Y axis is log2-expression. |
|||||||||||||||||||||||||||||||||||||||||||||||||||||||
| AtGenExpress* (Hormone) |
258109_at
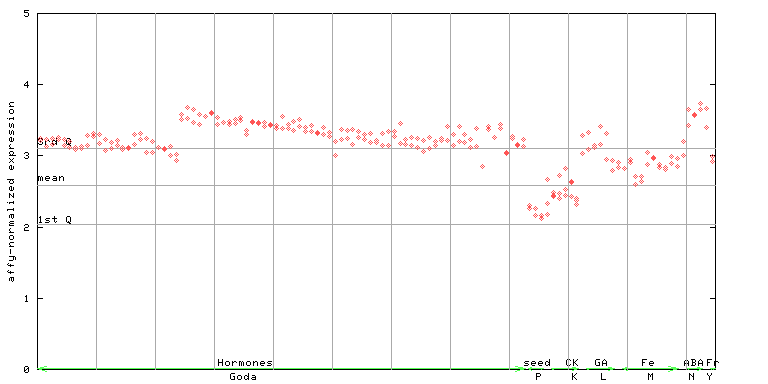
X axis is samples (xls file), and Y axis is log-expression. |
|||||||||||||||||||||||||||||||||||||||||||||||||||||||


")
")
")
")
| Link to other DBs | ||
| Entrez Gene ID | 821944 |
|
| Refseq ID (protein) | NP_001118685.1 | |
| NP_001327915.1 | |
|
| NP_566736.1 | |
|
The preparation time of this page was 0.3 [sec].