[←][→] ath
| functional annotation | |||||||||||||||||||||||||||||||||||||||||||||||||||||||
| Function | hydroxyethylthiazole kinase family protein |


|
|||||||||||||||||||||||||||||||||||||||||||||||||||||
| GO BP |
|
||||||||||||||||||||||||||||||||||||||||||||||||||||||
| GO CC |
|
||||||||||||||||||||||||||||||||||||||||||||||||||||||
| GO MF |
|
||||||||||||||||||||||||||||||||||||||||||||||||||||||
| KEGG | ath00730 [list] [network] Thiamine metabolism (21 genes) |  |
|||||||||||||||||||||||||||||||||||||||||||||||||||||
| ath00740 [list] [network] Riboflavin metabolism (20 genes) | |
||||||||||||||||||||||||||||||||||||||||||||||||||||||
| ath01240 [list] [network] Biosynthesis of cofactors (236 genes) | |
||||||||||||||||||||||||||||||||||||||||||||||||||||||
| Protein | NP_001319628.1 | ||||||||||||||||||||||||||||||||||||||||||||||||||||||
| BLAST | NP_001319628.1 | ||||||||||||||||||||||||||||||||||||||||||||||||||||||
| Orthologous | [Ortholog page] LOC7481239 (ppo) LOC9269112 (osa) LOC25483061 (mtr) LOC25483081 (mtr) LOC100786113 (gma) LOC101263028 (sly) LOC103828666 (bra) LOC123063340 (tae) LOC123063347 (tae) LOC123066482 (tae) LOC123072322 (tae) LOC123080553 (tae) LOC123080574 (tae) LOC123440838 (hvu) | ||||||||||||||||||||||||||||||||||||||||||||||||||||||
| Subcellular localization wolf |
|
||||||||||||||||||||||||||||||||||||||||||||||||||||||
| Subcellular localization TargetP |
|
||||||||||||||||||||||||||||||||||||||||||||||||||||||
| Gene coexpression | |||||||||||||||||||||||||||||||||||||||||||||||||||||||
| Network*for coexpressed genes |
|
||||||||||||||||||||||||||||||||||||||||||||||||||||||
|---|---|---|---|---|---|---|---|---|---|---|---|---|---|---|---|---|---|---|---|---|---|---|---|---|---|---|---|---|---|---|---|---|---|---|---|---|---|---|---|---|---|---|---|---|---|---|---|---|---|---|---|---|---|---|---|
| Coexpressed gene list |
[Coexpressed gene list for AT3G24030] | ||||||||||||||||||||||||||||||||||||||||||||||||||||||
| Gene expression | |||||||||||||||||||||||||||||||||||||||||||||||||||||||
| All samples | [Expression pattern for all samples] | ||||||||||||||||||||||||||||||||||||||||||||||||||||||
| AtGenExpress* (Development) |
256907_at
X axis is samples (pdf file), and Y axis is log2-expression. |
||||||||||||||||||||||||||||||||||||||||||||||||||||||
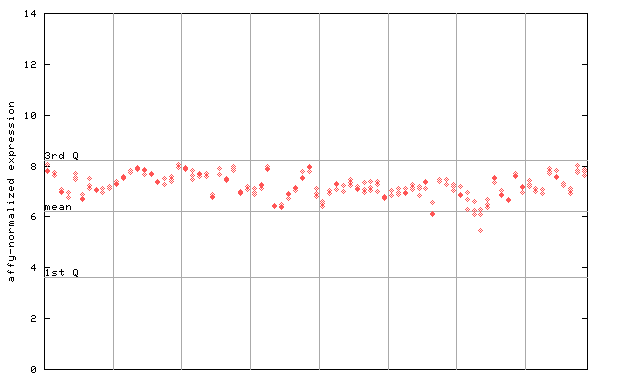
| AtGenExpress* (Stress) |
256907_at
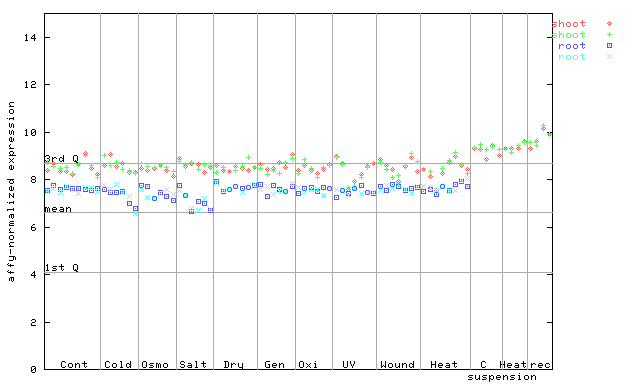
X axis is samples (pdf file), and Y axis is log2-expression. |
||||||||||||||||||||||||||||||||||||||||||||||||||||||
| AtGenExpress* (Hormone) |
256907_at
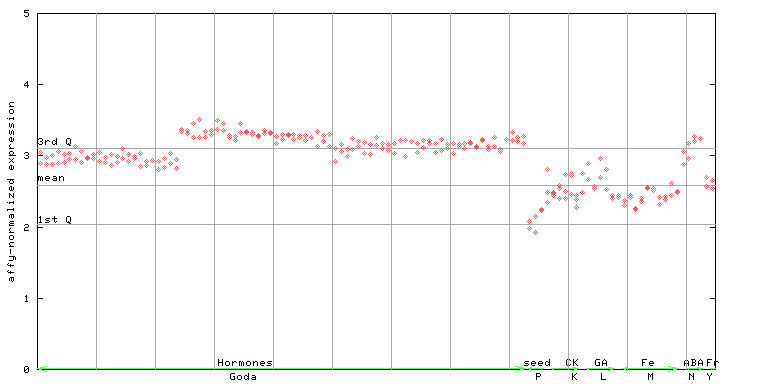
X axis is samples (xls file), and Y axis is log-expression. |
||||||||||||||||||||||||||||||||||||||||||||||||||||||


")
")
")
")
")
| Link to other DBs | ||
| Entrez Gene ID | 821988 |
|
| Refseq ID (protein) | NP_001319628.1 | |
The preparation time of this page was 0.1 [sec].