[←][→] ath
| functional annotation | ||||||||||
| Function | hypothetical protein |


|
||||||||
| GO BP |
|
|||||||||
| GO CC |
|
|||||||||
| GO MF |
|
|||||||||
| KEGG | ||||||||||
| Protein | NP_001326957.1 NP_001326958.1 NP_189119.2 | |||||||||
| BLAST | NP_001326957.1 NP_001326958.1 NP_189119.2 | |||||||||
| Orthologous | [Ortholog page] LOC7471131 (ppo) LOC11408552 (mtr) LOC25479771 (mtr) LOC25479772 (mtr) LOC101261061 (sly) LOC101262531 (sly) LOC102661962 (gma) LOC102667880 (gma) LOC102668111 (gma) LOC103828607 (bra) LOC104879829 (vvi) | |||||||||
| Subcellular localization wolf |
|
|||||||||
| Subcellular localization TargetP |
|
|||||||||
| Gene coexpression | ||||||||||
| Network*for coexpressed genes |
||||||||||
|---|---|---|---|---|---|---|---|---|---|---|
| Coexpressed gene list |
[Coexpressed gene list for AT3G24750] | |||||||||
| Gene expression | ||||||||||
| All samples | [Expression pattern for all samples] | |||||||||
| AtGenExpress* (Development) |
257595_at
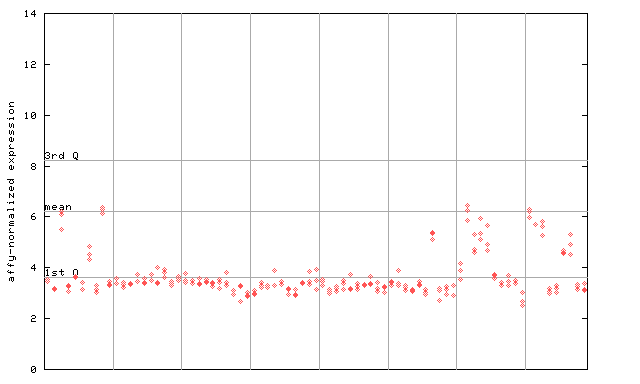
X axis is samples (pdf file), and Y axis is log2-expression. |
|||||||||
| AtGenExpress* (Stress) |
257595_at
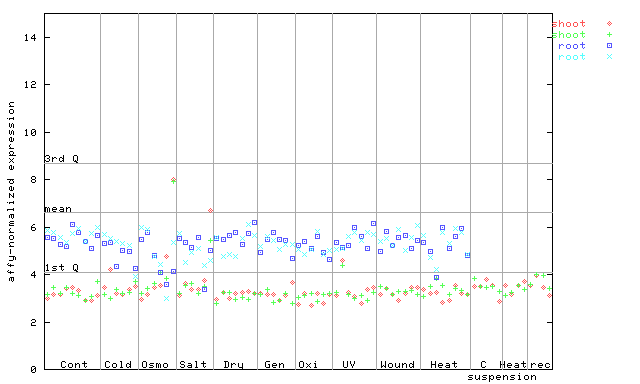
X axis is samples (pdf file), and Y axis is log2-expression. |
|||||||||
| AtGenExpress* (Hormone) |
257595_at
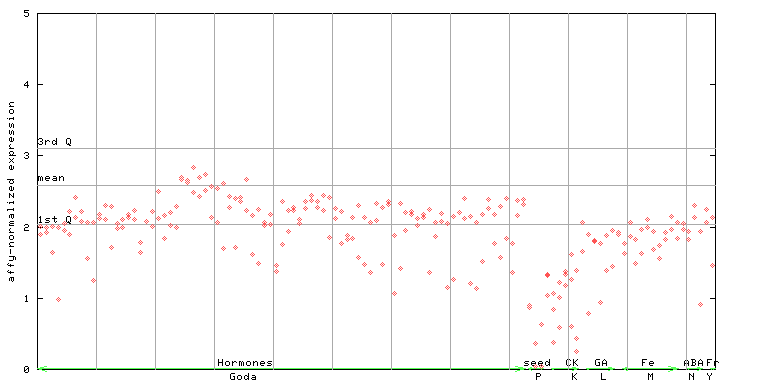
X axis is samples (xls file), and Y axis is log-expression. |
|||||||||

| Link to other DBs | ||
| Entrez Gene ID | 822073 |
|
| Refseq ID (protein) | NP_001326957.1 | |
| NP_001326958.1 | |
|
| NP_189119.2 | |
|
The preparation time of this page was 0.1 [sec].