[←][→] ath
| functional annotation | |||||||||||||||||||||||||||||||||||||||||||||||||||||||
| Function | Sucrase/ferredoxin-like family protein |


|
|||||||||||||||||||||||||||||||||||||||||||||||||||||
| GO BP |
|
||||||||||||||||||||||||||||||||||||||||||||||||||||||
| GO CC |
|
||||||||||||||||||||||||||||||||||||||||||||||||||||||
| GO MF |
|
||||||||||||||||||||||||||||||||||||||||||||||||||||||
| KEGG | |||||||||||||||||||||||||||||||||||||||||||||||||||||||
| Protein | NP_001327128.1 NP_566821.2 | ||||||||||||||||||||||||||||||||||||||||||||||||||||||
| BLAST | NP_001327128.1 NP_566821.2 | ||||||||||||||||||||||||||||||||||||||||||||||||||||||
| Orthologous | [Ortholog page] AT5G40510 (ath) LOC7466951 (ppo) LOC25495136 (mtr) LOC25497928 (mtr) LOC100785795 (gma) LOC100787214 (gma) LOC100811548 (gma) LOC101256549 (sly) LOC101262369 (sly) LOC103854224 (bra) LOC103863999 (bra) LOC103875204 (bra) | ||||||||||||||||||||||||||||||||||||||||||||||||||||||
| Subcellular localization wolf |
|
||||||||||||||||||||||||||||||||||||||||||||||||||||||
| Subcellular localization TargetP |
|
||||||||||||||||||||||||||||||||||||||||||||||||||||||
| Gene coexpression | |||||||||||||||||||||||||||||||||||||||||||||||||||||||
| Network*for coexpressed genes |
|
||||||||||||||||||||||||||||||||||||||||||||||||||||||
|---|---|---|---|---|---|---|---|---|---|---|---|---|---|---|---|---|---|---|---|---|---|---|---|---|---|---|---|---|---|---|---|---|---|---|---|---|---|---|---|---|---|---|---|---|---|---|---|---|---|---|---|---|---|---|---|
| Coexpressed gene list |
[Coexpressed gene list for AT3G27570] | ||||||||||||||||||||||||||||||||||||||||||||||||||||||
| Gene expression | |||||||||||||||||||||||||||||||||||||||||||||||||||||||
| All samples | [Expression pattern for all samples] | ||||||||||||||||||||||||||||||||||||||||||||||||||||||
| AtGenExpress* (Development) |
257970_at
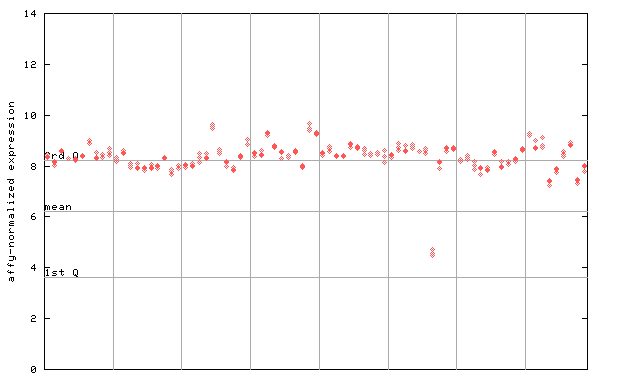
X axis is samples (pdf file), and Y axis is log2-expression. |
||||||||||||||||||||||||||||||||||||||||||||||||||||||
| AtGenExpress* (Stress) |
257970_at
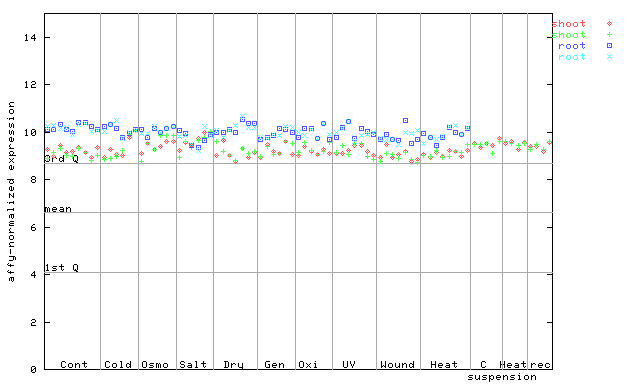
X axis is samples (pdf file), and Y axis is log2-expression. |
||||||||||||||||||||||||||||||||||||||||||||||||||||||
| AtGenExpress* (Hormone) |
257970_at
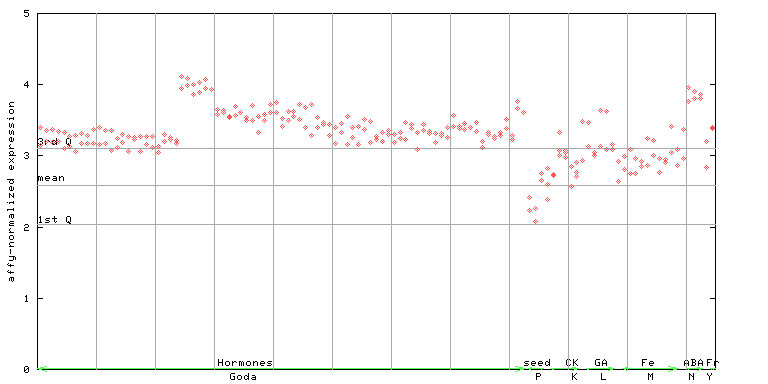
X axis is samples (xls file), and Y axis is log-expression. |
||||||||||||||||||||||||||||||||||||||||||||||||||||||


")
")
")
")
")
| Link to other DBs | ||
| Entrez Gene ID | 822379 |
|
| Refseq ID (protein) | NP_001327128.1 | |
| NP_566821.2 | |
|
The preparation time of this page was 0.1 [sec].