[←][→] ath
| functional annotation | ||||||||||||||||||||||||||||||||||||
| Function | cytidine/deoxycytidylate deaminase family protein |

 Plant GARDEN Plant GARDEN JBrowse
|
||||||||||||||||||||||||||||||||||
| GO BP |
|
|||||||||||||||||||||||||||||||||||
| GO CC |
|
|||||||||||||||||||||||||||||||||||
| GO MF |
|
|||||||||||||||||||||||||||||||||||
| KEGG | ath00740 [list] [network] Riboflavin metabolism (20 genes) |  |
||||||||||||||||||||||||||||||||||
| ath01240 [list] [network] Biosynthesis of cofactors (236 genes) | |
|||||||||||||||||||||||||||||||||||
| Protein | NP_001190026.1 NP_190323.1 | |||||||||||||||||||||||||||||||||||
| BLAST | NP_001190026.1 NP_190323.1 | |||||||||||||||||||||||||||||||||||
| Orthologous | [Ortholog page] LOC4329349 (osa) LOC7459224 (ppo) LOC25498913 (mtr) LOC100801283 (gma) LOC100812653 (gma) LOC101248871 (sly) LOC103873252 (bra) LOC123129003 (tae) LOC123139880 (tae) LOC123146180 (tae) LOC123405875 (hvu) | |||||||||||||||||||||||||||||||||||
| Subcellular localization wolf |
|
|||||||||||||||||||||||||||||||||||
| Subcellular localization TargetP |
|
|||||||||||||||||||||||||||||||||||
| Gene coexpression | ||||||||||||||||||||||||||||||||||||
| Network*for coexpressed genes |
|
|||||||||||||||||||||||||||||||||||
|---|---|---|---|---|---|---|---|---|---|---|---|---|---|---|---|---|---|---|---|---|---|---|---|---|---|---|---|---|---|---|---|---|---|---|---|---|
| Coexpressed gene list |
[Coexpressed gene list for PHS1] | |||||||||||||||||||||||||||||||||||
| Gene expression | ||||||||||||||||||||||||||||||||||||
| All samples | [Expression pattern for all samples] | |||||||||||||||||||||||||||||||||||
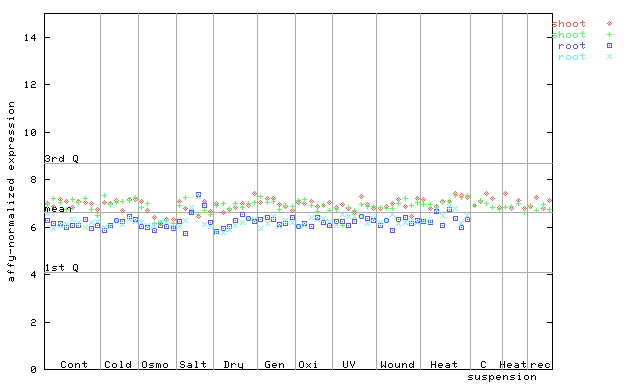
| AtGenExpress* (Development) |
252438_at
X axis is samples (pdf file), and Y axis is log2-expression. |
|||||||||||||||||||||||||||||||||||
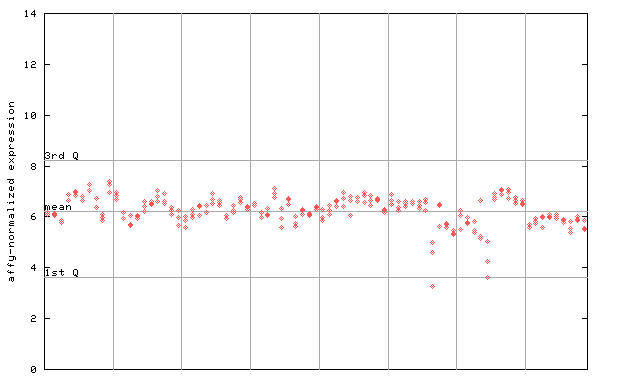
| AtGenExpress* (Stress) |
252438_at
X axis is samples (pdf file), and Y axis is log2-expression. |
|||||||||||||||||||||||||||||||||||
| AtGenExpress* (Hormone) |
252438_at
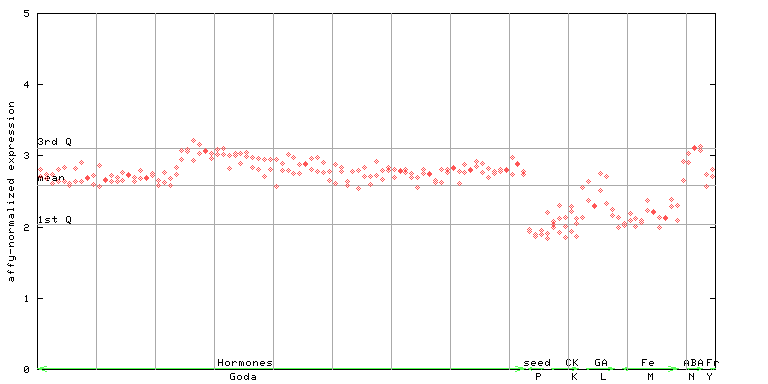
X axis is samples (xls file), and Y axis is log-expression. |
|||||||||||||||||||||||||||||||||||


| Link to other DBs | ||
| Entrez Gene ID | 823893 |
|
| Refseq ID (protein) | NP_001190026.1 | |
| NP_190323.1 | |
|
The preparation time of this page was 0.1 [sec].