[←][→] ath
| functional annotation | ||||||||||||||||||||||||||||||||||
| Function | L-galactono-1,4-lactone dehydrogenase |


|
||||||||||||||||||||||||||||||||
| GO BP |
|
|||||||||||||||||||||||||||||||||
| GO CC |
|
|||||||||||||||||||||||||||||||||
| GO MF |
|
|||||||||||||||||||||||||||||||||
| KEGG | ath00053 [list] [network] Ascorbate and aldarate metabolism (63 genes) |  |
||||||||||||||||||||||||||||||||
| ath01240 [list] [network] Biosynthesis of cofactors (236 genes) | |
|||||||||||||||||||||||||||||||||
| Protein | NP_001319706.1 NP_190376.1 | |||||||||||||||||||||||||||||||||
| BLAST | NP_001319706.1 NP_190376.1 | |||||||||||||||||||||||||||||||||
| Orthologous | [Ortholog page] gldh (sly) LOC4349749 (osa) LOC4351464 (osa) LOC7464114 (ppo) LOC11434475 (mtr) LOC100526948 (gma) LOC100793515 (gma) GLDH (bra) LOC123103035 (tae) LOC123111215 (tae) LOC123120310 (tae) LOC123452547 (hvu) | |||||||||||||||||||||||||||||||||
| Subcellular localization wolf |
|
|||||||||||||||||||||||||||||||||
| Subcellular localization TargetP |
|
|||||||||||||||||||||||||||||||||
| Gene coexpression | ||||||||||||||||||||||||||||||||||
| Network*for coexpressed genes |
|
|||||||||||||||||||||||||||||||||
|---|---|---|---|---|---|---|---|---|---|---|---|---|---|---|---|---|---|---|---|---|---|---|---|---|---|---|---|---|---|---|---|---|---|---|
| Coexpressed gene list |
[Coexpressed gene list for GLDH] | |||||||||||||||||||||||||||||||||
| Gene expression | ||||||||||||||||||||||||||||||||||
| All samples | [Expression pattern for all samples] | |||||||||||||||||||||||||||||||||
| AtGenExpress* (Development) |
252376_at
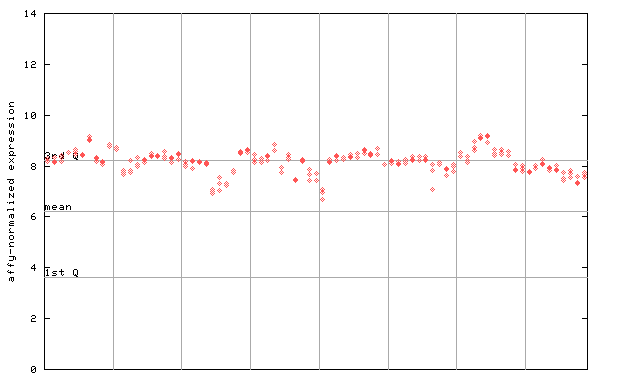
X axis is samples (pdf file), and Y axis is log2-expression. |
|||||||||||||||||||||||||||||||||
| AtGenExpress* (Stress) |
252376_at
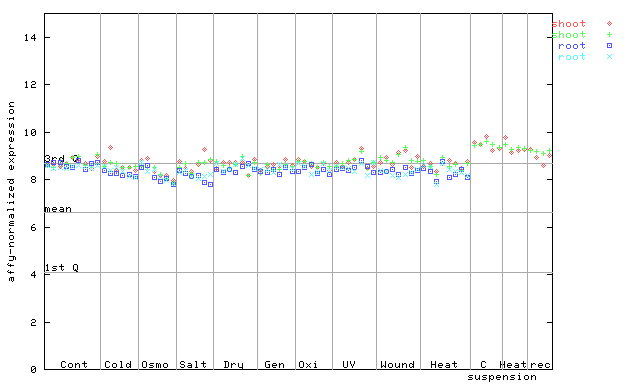
X axis is samples (pdf file), and Y axis is log2-expression. |
|||||||||||||||||||||||||||||||||
| AtGenExpress* (Hormone) |
252376_at
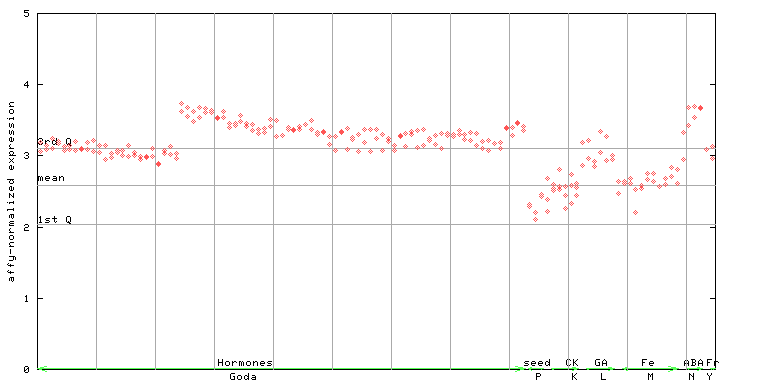
X axis is samples (xls file), and Y axis is log-expression. |
|||||||||||||||||||||||||||||||||


")
| Link to other DBs | ||
| Entrez Gene ID | 823948 |
|
| Refseq ID (protein) | NP_001319706.1 | |
| NP_190376.1 | |
|
The preparation time of this page was 0.1 [sec].