[←][→] ath
| functional annotation | ||||||||||||||||||||||||||||||||||||||||||||||||||||||||||||||
| Function | glutamate-1-semialdehyde 2,1-aminomutase 2 |

 Plant GARDEN Plant GARDEN JBrowse
|
||||||||||||||||||||||||||||||||||||||||||||||||||||||||||||
| GO BP |
|
|||||||||||||||||||||||||||||||||||||||||||||||||||||||||||||
| GO CC |
|
|||||||||||||||||||||||||||||||||||||||||||||||||||||||||||||
| GO MF |
|
|||||||||||||||||||||||||||||||||||||||||||||||||||||||||||||
| KEGG | ath00860 [list] [network] Porphyrin metabolism (53 genes) |  |
||||||||||||||||||||||||||||||||||||||||||||||||||||||||||||
| ath01240 [list] [network] Biosynthesis of cofactors (236 genes) | |
|||||||||||||||||||||||||||||||||||||||||||||||||||||||||||||
| Protein | NP_190442.1 | |||||||||||||||||||||||||||||||||||||||||||||||||||||||||||||
| BLAST | NP_190442.1 | |||||||||||||||||||||||||||||||||||||||||||||||||||||||||||||
| Orthologous | [Ortholog page] GSA-AT (sly) GSA1 (gma) GSA1 (ath) LOC4346136 (osa) LOC7456623 (ppo) LOC11420447 (mtr) LOC100790574 (gma) LOC103837478 (bra) LOC103873768 (bra) LOC123151833 (tae) LOC123155954 (tae) LOC123164340 (tae) LOC123407287 (hvu) | |||||||||||||||||||||||||||||||||||||||||||||||||||||||||||||
| Subcellular localization wolf |
|
|||||||||||||||||||||||||||||||||||||||||||||||||||||||||||||
| Subcellular localization TargetP |
|
|||||||||||||||||||||||||||||||||||||||||||||||||||||||||||||
| Gene coexpression | ||||||||||||||||||||||||||||||||||||||||||||||||||||||||||||||
| Network*for coexpressed genes |
|
|||||||||||||||||||||||||||||||||||||||||||||||||||||||||||||
|---|---|---|---|---|---|---|---|---|---|---|---|---|---|---|---|---|---|---|---|---|---|---|---|---|---|---|---|---|---|---|---|---|---|---|---|---|---|---|---|---|---|---|---|---|---|---|---|---|---|---|---|---|---|---|---|---|---|---|---|---|---|---|
| Coexpressed gene list |
[Coexpressed gene list for GSA2] | |||||||||||||||||||||||||||||||||||||||||||||||||||||||||||||
| Gene expression | ||||||||||||||||||||||||||||||||||||||||||||||||||||||||||||||
| All samples | [Expression pattern for all samples] | |||||||||||||||||||||||||||||||||||||||||||||||||||||||||||||
| AtGenExpress* (Development) |
252318_at
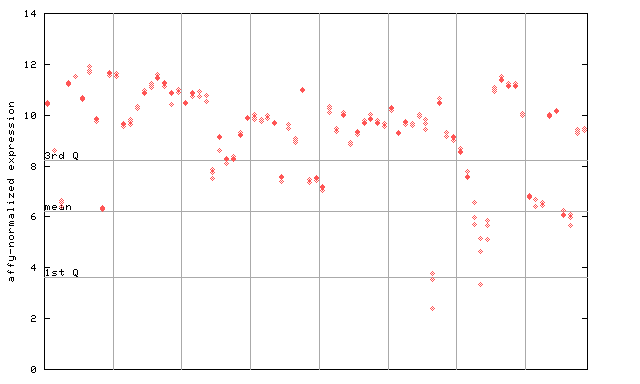
X axis is samples (pdf file), and Y axis is log2-expression. |
|||||||||||||||||||||||||||||||||||||||||||||||||||||||||||||
| AtGenExpress* (Stress) |
252318_at
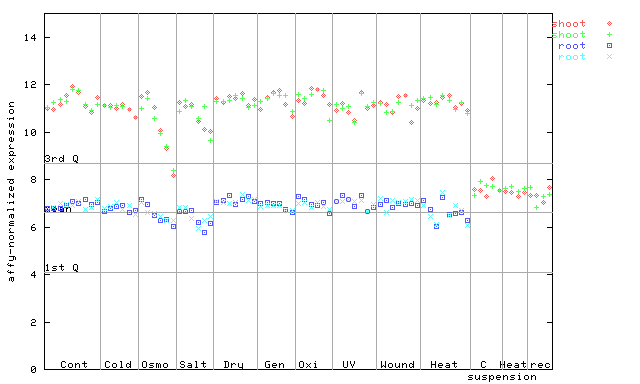
X axis is samples (pdf file), and Y axis is log2-expression. |
|||||||||||||||||||||||||||||||||||||||||||||||||||||||||||||
| AtGenExpress* (Hormone) |
252318_at
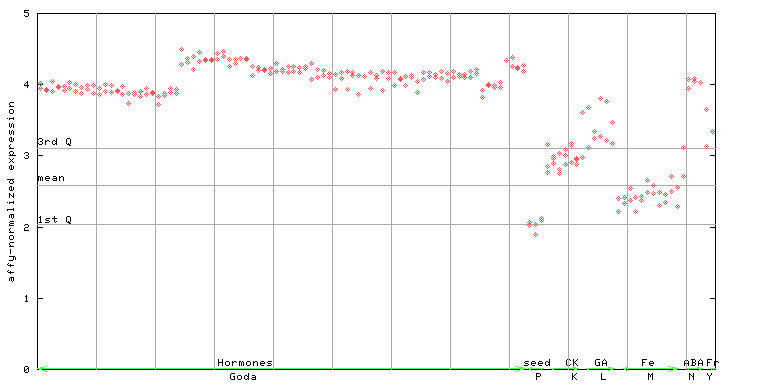
X axis is samples (xls file), and Y axis is log-expression. |
|||||||||||||||||||||||||||||||||||||||||||||||||||||||||||||


")
")
")
| Link to other DBs | ||
| Entrez Gene ID | 824034 |
|
| Refseq ID (protein) | NP_190442.1 | |
The preparation time of this page was 0.1 [sec].