[←][→] ath
| functional annotation | ||||||||||||||||||||||||||||||||||||||||||||||||||
| Function | UbiA prenyltransferase family protein |


|
||||||||||||||||||||||||||||||||||||||||||||||||
| GO BP |
|
|||||||||||||||||||||||||||||||||||||||||||||||||
| GO CC |
|
|||||||||||||||||||||||||||||||||||||||||||||||||
| GO MF |
|
|||||||||||||||||||||||||||||||||||||||||||||||||
| KEGG | ath00860 [list] [network] Porphyrin and chlorophyll metabolism (53 genes) |  |
||||||||||||||||||||||||||||||||||||||||||||||||
| Protein | NP_190750.1 | |||||||||||||||||||||||||||||||||||||||||||||||||
| BLAST | NP_190750.1 | |||||||||||||||||||||||||||||||||||||||||||||||||
| Orthologous | [Ortholog page] LOC4338498 (osa) LOC7487329 (ppo) LOC25498789 (mtr) LOC100250669 (vvi) LOC100274372 (zma) LOC100779167 (gma) LOC100787459 (gma) LOC100800348 (gma) LOC101246752 (sly) LOC103841124 (bra) LOC103848641 (bra) | |||||||||||||||||||||||||||||||||||||||||||||||||
| Subcellular localization wolf |
|
|||||||||||||||||||||||||||||||||||||||||||||||||
| Subcellular localization TargetP |
|
|||||||||||||||||||||||||||||||||||||||||||||||||
| Gene coexpression | ||||||||||||||||||||||||||||||||||||||||||||||||||
| Network*for coexpressed genes |
|
|||||||||||||||||||||||||||||||||||||||||||||||||
|---|---|---|---|---|---|---|---|---|---|---|---|---|---|---|---|---|---|---|---|---|---|---|---|---|---|---|---|---|---|---|---|---|---|---|---|---|---|---|---|---|---|---|---|---|---|---|---|---|---|---|
| Coexpressed gene list |
[Coexpressed gene list for G4] | |||||||||||||||||||||||||||||||||||||||||||||||||
| Gene expression | ||||||||||||||||||||||||||||||||||||||||||||||||||
| All samples | [Expression pattern for all samples] | |||||||||||||||||||||||||||||||||||||||||||||||||
| AtGenExpress* (Development) |
246308_at
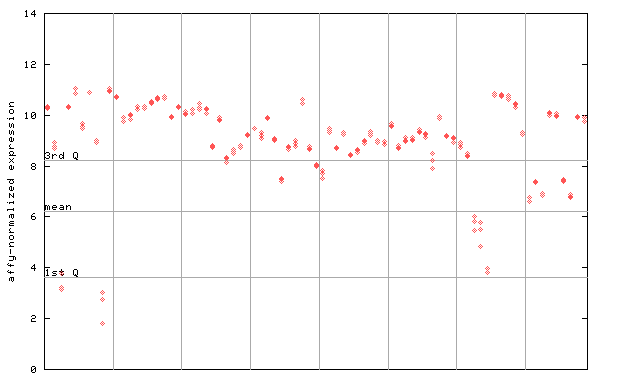
X axis is samples (pdf file), and Y axis is log2-expression. |
|||||||||||||||||||||||||||||||||||||||||||||||||
| AtGenExpress* (Stress) |
246308_at
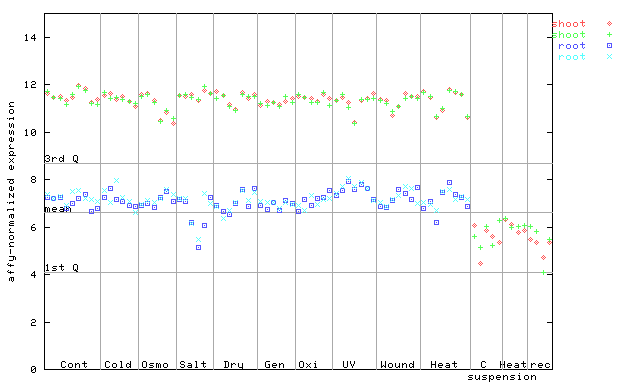
X axis is samples (pdf file), and Y axis is log2-expression. |
|||||||||||||||||||||||||||||||||||||||||||||||||
| AtGenExpress* (Hormone) |
246308_at
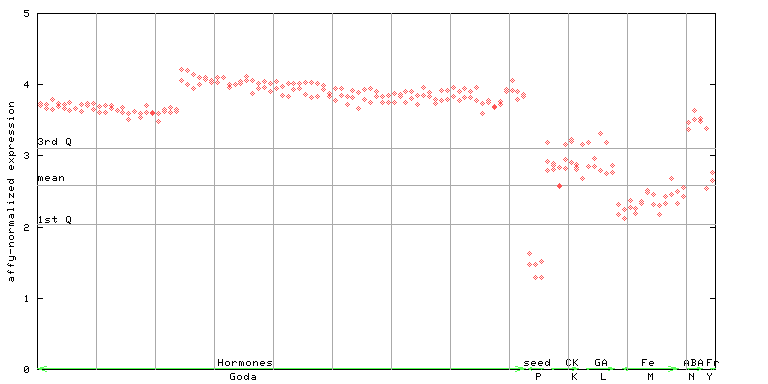
X axis is samples (xls file), and Y axis is log-expression. |
|||||||||||||||||||||||||||||||||||||||||||||||||


")
")
")
")
")
| Link to other DBs | ||
| Entrez Gene ID | 824345 |
|
| Refseq ID (protein) | NP_190750.1 | |
The preparation time of this page was 0.1 [sec].