[←][→] ath
| functional annotation | ||||||||||||||||||||||||||||||||||||||||||
| Function | thyroid adenoma-associated-like protein |


|
||||||||||||||||||||||||||||||||||||||||
| GO BP |
|
|||||||||||||||||||||||||||||||||||||||||
| GO CC |
|
|||||||||||||||||||||||||||||||||||||||||
| GO MF |
|
|||||||||||||||||||||||||||||||||||||||||
| KEGG | ||||||||||||||||||||||||||||||||||||||||||
| Protein | NP_001319755.1 NP_001326116.1 NP_001326117.1 | |||||||||||||||||||||||||||||||||||||||||
| BLAST | NP_001319755.1 NP_001326116.1 NP_001326117.1 | |||||||||||||||||||||||||||||||||||||||||
| Orthologous | [Ortholog page] LOC4344765 (osa) LOC7468401 (ppo) LOC25495297 (mtr) LOC100257679 (vvi) LOC100776536 (gma) LOC101261303 (sly) LOC103641217 (zma) LOC103875123 (bra) | |||||||||||||||||||||||||||||||||||||||||
| Subcellular localization wolf |
|
|||||||||||||||||||||||||||||||||||||||||
| Subcellular localization TargetP |
|
|||||||||||||||||||||||||||||||||||||||||
| Gene coexpression | ||||||||||||||||||||||||||||||||||||||||||
| Network*for coexpressed genes |
|
|||||||||||||||||||||||||||||||||||||||||
|---|---|---|---|---|---|---|---|---|---|---|---|---|---|---|---|---|---|---|---|---|---|---|---|---|---|---|---|---|---|---|---|---|---|---|---|---|---|---|---|---|---|---|
| Coexpressed gene list |
[Coexpressed gene list for AT3G55160] | |||||||||||||||||||||||||||||||||||||||||
| Gene expression | ||||||||||||||||||||||||||||||||||||||||||
| All samples | [Expression pattern for all samples] | |||||||||||||||||||||||||||||||||||||||||
| AtGenExpress* (Development) |
251833_at
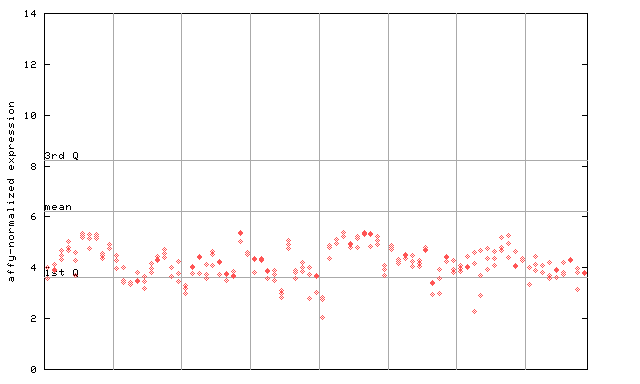
X axis is samples (pdf file), and Y axis is log2-expression. |
|||||||||||||||||||||||||||||||||||||||||
| AtGenExpress* (Stress) |
251833_at
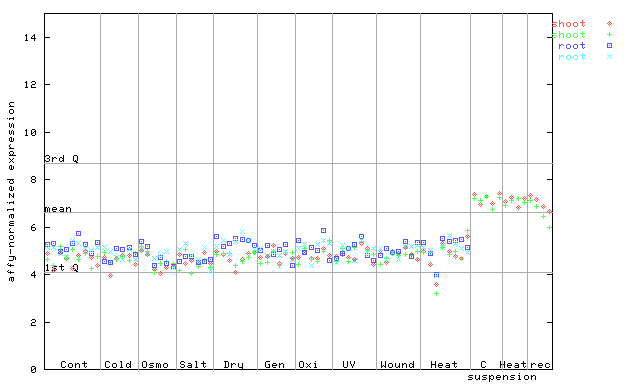
X axis is samples (pdf file), and Y axis is log2-expression. |
|||||||||||||||||||||||||||||||||||||||||
| AtGenExpress* (Hormone) |
251833_at
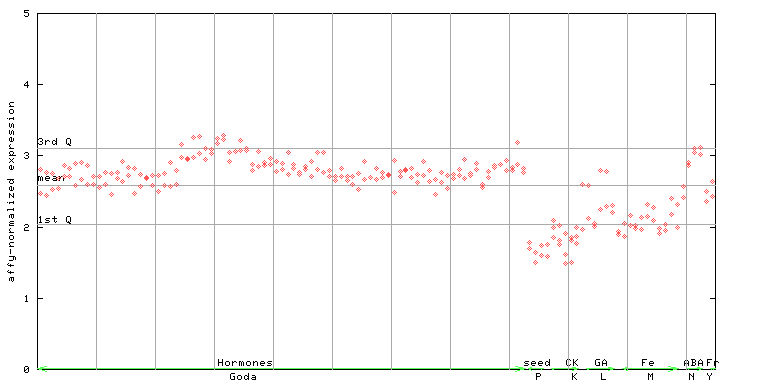
X axis is samples (xls file), and Y axis is log-expression. |
|||||||||||||||||||||||||||||||||||||||||


")
")
")
| Link to other DBs | ||
| Entrez Gene ID | 824682 |
|
| Refseq ID (protein) | NP_001319755.1 | |
| NP_001326116.1 | |
|
| NP_001326117.1 | |
|
The preparation time of this page was 0.2 [sec].