[←][→] ath
| functional annotation | ||||||||||||||
| Function | exostosin family protein |


|
||||||||||||
| GO BP |
|
|||||||||||||
| GO CC |
|
|||||||||||||
| GO MF |
|
|||||||||||||
| KEGG | ||||||||||||||
| Protein | NP_001327768.1 NP_191322.3 NP_974452.1 | |||||||||||||
| BLAST | NP_001327768.1 NP_191322.3 NP_974452.1 | |||||||||||||
| Orthologous | [Ortholog page] LOC4331790 (osa) LOC7485455 (ppo) LOC25483423 (mtr) LOC100267584 (vvi) LOC100783624 (gma) LOC100807663 (gma) LOC101249053 (sly) LOC103639530 (zma) LOC103841670 (bra) | |||||||||||||
| Subcellular localization wolf |
|
|||||||||||||
| Subcellular localization TargetP |
|
|||||||||||||
| Gene coexpression | ||||||||||||||
| Network*for coexpressed genes |
||||||||||||||
|---|---|---|---|---|---|---|---|---|---|---|---|---|---|---|
| Coexpressed gene list |
[Coexpressed gene list for AT3G57630] | |||||||||||||
| Gene expression | ||||||||||||||
| All samples | [Expression pattern for all samples] | |||||||||||||
| AtGenExpress* (Development) |
251594_at
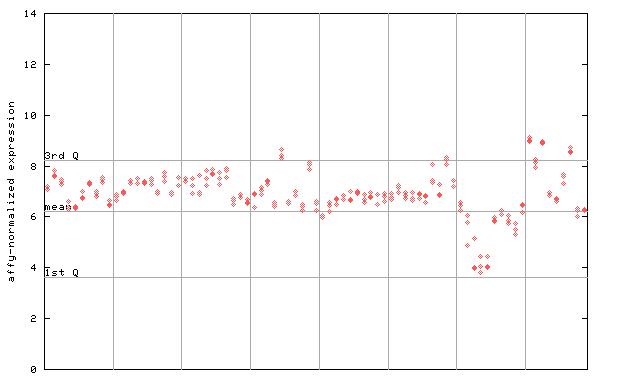
X axis is samples (pdf file), and Y axis is log2-expression. |
|||||||||||||
| AtGenExpress* (Stress) |
251594_at
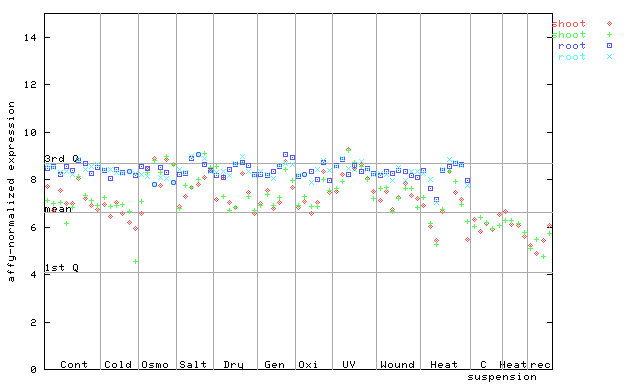
X axis is samples (pdf file), and Y axis is log2-expression. |
|||||||||||||
| AtGenExpress* (Hormone) |
251594_at
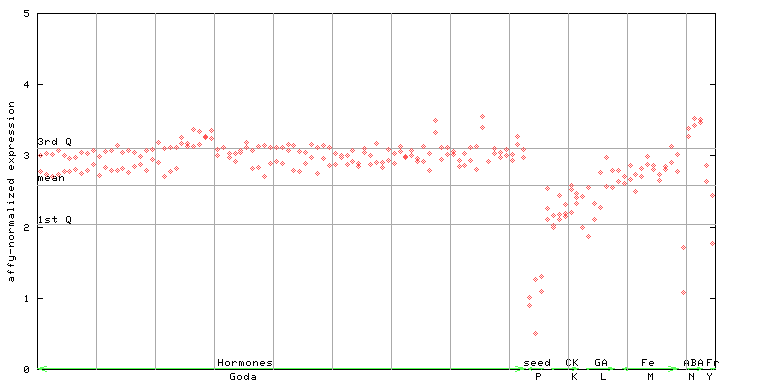
X axis is samples (xls file), and Y axis is log-expression. |
|||||||||||||


| Link to other DBs | ||
| Entrez Gene ID | 824932 |
|
| Refseq ID (protein) | NP_001327768.1 | |
| NP_191322.3 | |
|
| NP_974452.1 | |
|
The preparation time of this page was 0.2 [sec].