[←][→] ath
| functional annotation | ||||||||||||||||||||||||||||||||||||||||||||
| Function | pectin methylesterase 61 |


|
||||||||||||||||||||||||||||||||||||||||||
| GO BP |
|
|||||||||||||||||||||||||||||||||||||||||||
| GO CC |
|
|||||||||||||||||||||||||||||||||||||||||||
| GO MF |
|
|||||||||||||||||||||||||||||||||||||||||||
| KEGG | ||||||||||||||||||||||||||||||||||||||||||||
| Protein | NP_191460.1 | |||||||||||||||||||||||||||||||||||||||||||
| BLAST | NP_191460.1 | |||||||||||||||||||||||||||||||||||||||||||
| Orthologous | [Ortholog page] ATPMEPCRD (ath) LOC4330938 (osa) LOC7468487 (ppo) LOC103841761 (bra) LOC103862956 (bra) LOC103866037 (bra) LOC103866689 (bra) LOC123128666 (tae) LOC123128667 (tae) LOC123134748 (tae) LOC123145798 (tae) LOC123145802 (tae) LOC123402985 (hvu) | |||||||||||||||||||||||||||||||||||||||||||
| Subcellular localization wolf |
|
|||||||||||||||||||||||||||||||||||||||||||
| Subcellular localization TargetP |
|
|||||||||||||||||||||||||||||||||||||||||||
| Gene coexpression | ||||||||||||||||||||||||||||||||||||||||||||
| Network*for coexpressed genes |
|
|||||||||||||||||||||||||||||||||||||||||||
|---|---|---|---|---|---|---|---|---|---|---|---|---|---|---|---|---|---|---|---|---|---|---|---|---|---|---|---|---|---|---|---|---|---|---|---|---|---|---|---|---|---|---|---|---|
| Coexpressed gene list |
[Coexpressed gene list for PME61] | |||||||||||||||||||||||||||||||||||||||||||
| Gene expression | ||||||||||||||||||||||||||||||||||||||||||||
| All samples | [Expression pattern for all samples] | |||||||||||||||||||||||||||||||||||||||||||
| AtGenExpress* (Development) |
251509_at
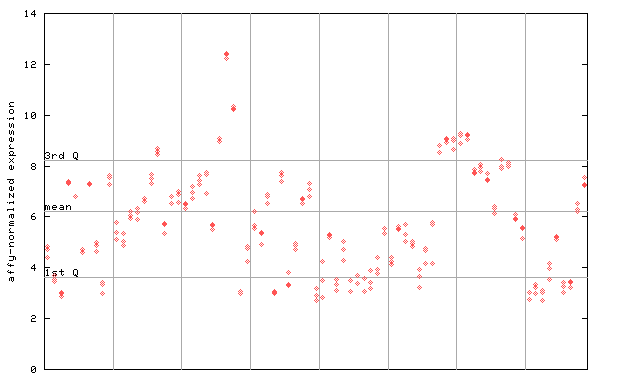
X axis is samples (pdf file), and Y axis is log2-expression. |
|||||||||||||||||||||||||||||||||||||||||||
| AtGenExpress* (Stress) |
251509_at
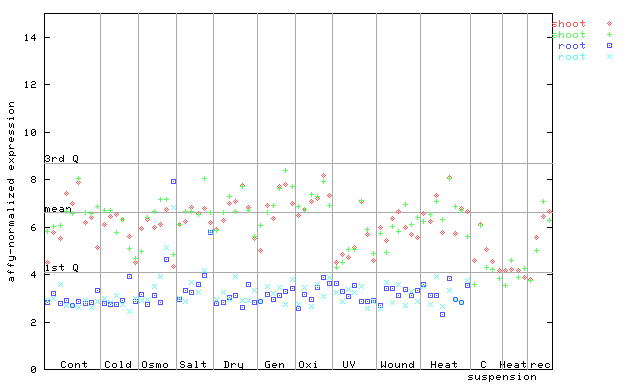
X axis is samples (pdf file), and Y axis is log2-expression. |
|||||||||||||||||||||||||||||||||||||||||||
| AtGenExpress* (Hormone) |
251509_at
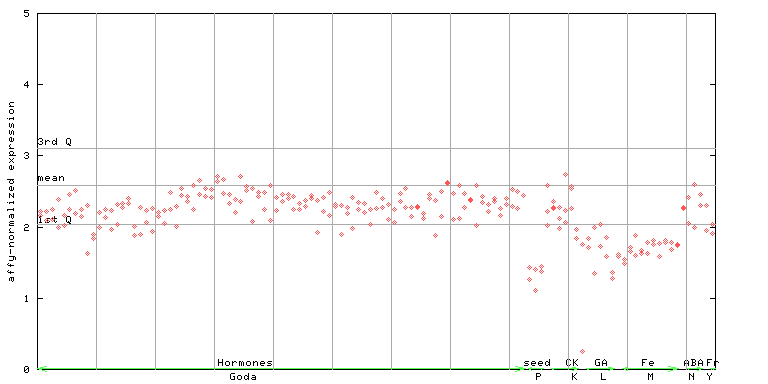
X axis is samples (xls file), and Y axis is log-expression. |
|||||||||||||||||||||||||||||||||||||||||||


")
| Link to other DBs | ||
| Entrez Gene ID | 825070 |
|
| Refseq ID (protein) | NP_191460.1 | |
The preparation time of this page was 0.1 [sec].