[←][→] ath
| functional annotation | ||||||||||||||||||||||||||||||||||||||||||
| Function | Rhodanese/Cell cycle control phosphatase superfamily protein |


|
||||||||||||||||||||||||||||||||||||||||
| GO BP |
|
|||||||||||||||||||||||||||||||||||||||||
| GO CC |
|
|||||||||||||||||||||||||||||||||||||||||
| GO MF |
|
|||||||||||||||||||||||||||||||||||||||||
| KEGG | ||||||||||||||||||||||||||||||||||||||||||
| Protein | NP_191537.4 | |||||||||||||||||||||||||||||||||||||||||
| BLAST | NP_191537.4 | |||||||||||||||||||||||||||||||||||||||||
| Orthologous | [Ortholog page] LOC4325097 (osa) LOC11444160 (mtr) LOC18104603 (ppo) LOC100786123 (gma) LOC100786142 (gma) LOC101256951 (sly) LOC103830228 (bra) LOC123057076 (tae) LOC123071718 (tae) LOC123076411 (tae) LOC123442026 (hvu) | |||||||||||||||||||||||||||||||||||||||||
| Subcellular localization wolf |
|
|||||||||||||||||||||||||||||||||||||||||
| Subcellular localization TargetP |
|
|||||||||||||||||||||||||||||||||||||||||
| Gene coexpression | ||||||||||||||||||||||||||||||||||||||||||
| Network*for coexpressed genes |
|
|||||||||||||||||||||||||||||||||||||||||
|---|---|---|---|---|---|---|---|---|---|---|---|---|---|---|---|---|---|---|---|---|---|---|---|---|---|---|---|---|---|---|---|---|---|---|---|---|---|---|---|---|---|---|
| Coexpressed gene list |
[Coexpressed gene list for AT3G59780] | |||||||||||||||||||||||||||||||||||||||||
| Gene expression | ||||||||||||||||||||||||||||||||||||||||||
| All samples | [Expression pattern for all samples] | |||||||||||||||||||||||||||||||||||||||||
| AtGenExpress* (Development) |
251461_at
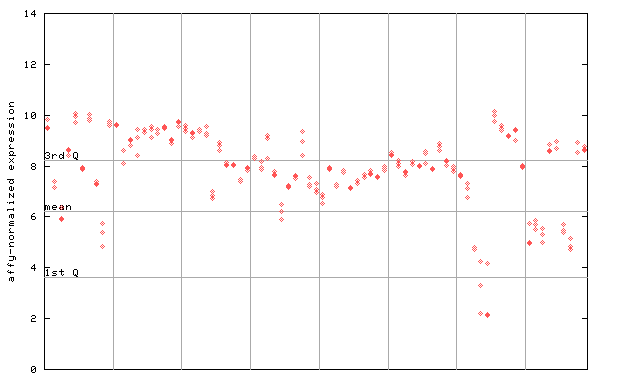
X axis is samples (pdf file), and Y axis is log2-expression. |
|||||||||||||||||||||||||||||||||||||||||
| AtGenExpress* (Stress) |
251461_at
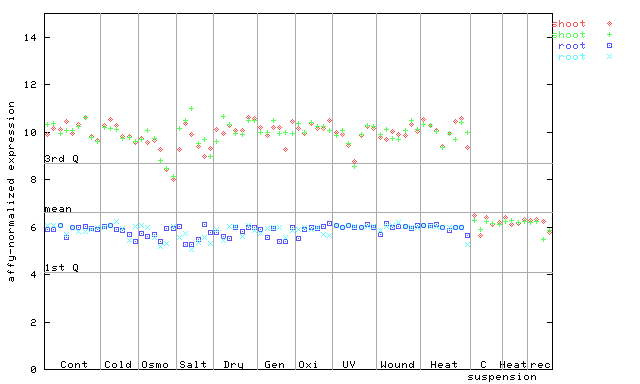
X axis is samples (pdf file), and Y axis is log2-expression. |
|||||||||||||||||||||||||||||||||||||||||
| AtGenExpress* (Hormone) |
251461_at
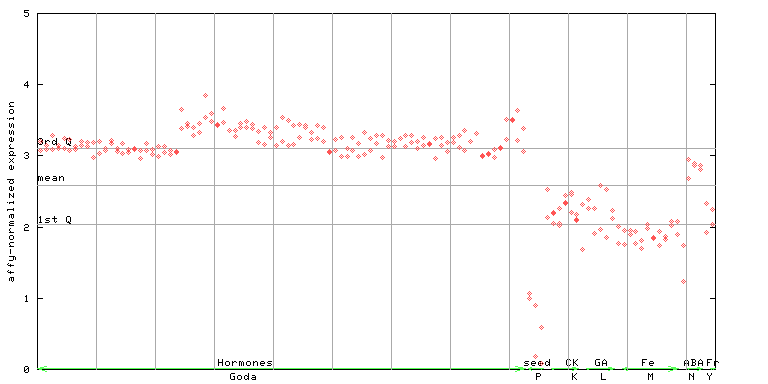
X axis is samples (xls file), and Y axis is log-expression. |
|||||||||||||||||||||||||||||||||||||||||


")
| Link to other DBs | ||
| Entrez Gene ID | 825147 |
|
| Refseq ID (protein) | NP_191537.4 | |
The preparation time of this page was 0.1 [sec].