[←][→] ath
| functional annotation | ||||||||||||||||||||||||||||||||||
| Function | cytochrome P450 family protein |


|
||||||||||||||||||||||||||||||||
| GO BP |
|
|||||||||||||||||||||||||||||||||
| GO CC |
|
|||||||||||||||||||||||||||||||||
| GO MF |
|
|||||||||||||||||||||||||||||||||
| KEGG | ||||||||||||||||||||||||||||||||||
| Protein | NP_001118866.1 NP_191618.2 NP_850729.2 NP_974468.1 | |||||||||||||||||||||||||||||||||
| BLAST | NP_001118866.1 NP_191618.2 NP_850729.2 NP_974468.1 | |||||||||||||||||||||||||||||||||
| Orthologous | [Ortholog page] LOC4336510 (osa) LOC11420743 (mtr) LOC18105192 (ppo) LOC100779126 (gma) LOC100806630 (gma) LOC101244710 (sly) LOC103841906 (bra) LOC103862874 (bra) LOC123046016 (tae) LOC123053890 (tae) LOC123189778 (tae) LOC123427349 (hvu) | |||||||||||||||||||||||||||||||||
| Subcellular localization wolf |
|
|||||||||||||||||||||||||||||||||
| Subcellular localization TargetP |
|
|||||||||||||||||||||||||||||||||
| Gene coexpression | ||||||||||||||||||||||||||||||||||
| Network*for coexpressed genes |
|
|||||||||||||||||||||||||||||||||
|---|---|---|---|---|---|---|---|---|---|---|---|---|---|---|---|---|---|---|---|---|---|---|---|---|---|---|---|---|---|---|---|---|---|---|
| Coexpressed gene list |
[Coexpressed gene list for AT3G60590] | |||||||||||||||||||||||||||||||||
| Gene expression | ||||||||||||||||||||||||||||||||||
| All samples | [Expression pattern for all samples] | |||||||||||||||||||||||||||||||||
| AtGenExpress* (Development) |
251399_at
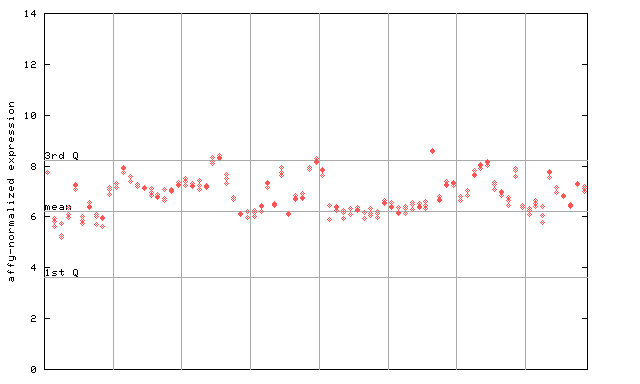
X axis is samples (pdf file), and Y axis is log2-expression. |
|||||||||||||||||||||||||||||||||
| AtGenExpress* (Stress) |
251399_at
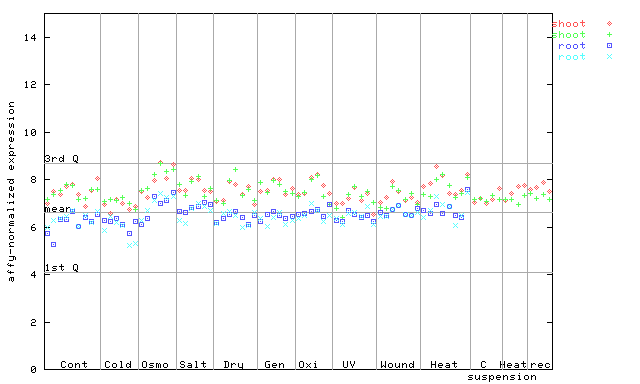
X axis is samples (pdf file), and Y axis is log2-expression. |
|||||||||||||||||||||||||||||||||
| AtGenExpress* (Hormone) |
251399_at
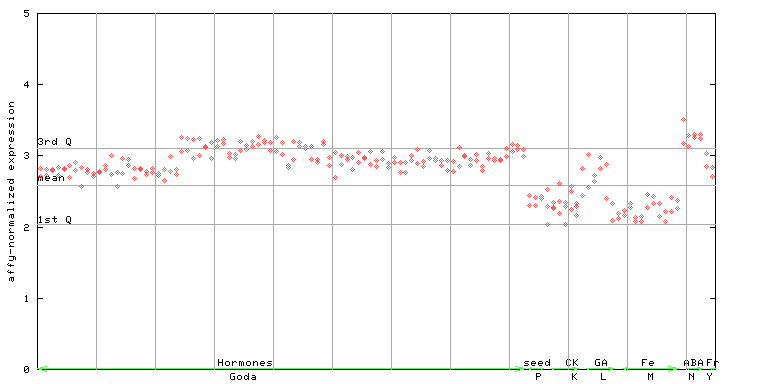
X axis is samples (xls file), and Y axis is log-expression. |
|||||||||||||||||||||||||||||||||


")
| Link to other DBs | ||
| Entrez Gene ID | 825230 |
|
| Refseq ID (protein) | NP_001118866.1 | |
| NP_191618.2 | |
|
| NP_850729.2 | |
|
| NP_974468.1 | |
|
The preparation time of this page was 0.1 [sec].