[←][→] ath
| functional annotation | ||||||||||||||||||||||||||||||||||
| Function | Chalcone-flavanone isomerase family protein |


|
||||||||||||||||||||||||||||||||
| GO BP |
|
|||||||||||||||||||||||||||||||||
| GO CC |
|
|||||||||||||||||||||||||||||||||
| GO MF |
|
|||||||||||||||||||||||||||||||||
| KEGG | ||||||||||||||||||||||||||||||||||
| Protein | NP_567140.1 | |||||||||||||||||||||||||||||||||
| BLAST | NP_567140.1 | |||||||||||||||||||||||||||||||||
| Orthologous | [Ortholog page] LOC4343668 (osa) LOC7480694 (ppo) LOC25499122 (mtr) LOC100257991 (vvi) LOC100283211 (zma) CHI3B2 (gma) CHI3B1 (gma) LOC101252697 (sly) LOC103842120 (bra) LOC103862719 (bra) | |||||||||||||||||||||||||||||||||
| Subcellular localization wolf |
|
|||||||||||||||||||||||||||||||||
| Subcellular localization TargetP |
|
|||||||||||||||||||||||||||||||||
| Gene coexpression | ||||||||||||||||||||||||||||||||||
| Network*for coexpressed genes |
|
|||||||||||||||||||||||||||||||||
|---|---|---|---|---|---|---|---|---|---|---|---|---|---|---|---|---|---|---|---|---|---|---|---|---|---|---|---|---|---|---|---|---|---|---|
| Coexpressed gene list |
[Coexpressed gene list for FAP1] | |||||||||||||||||||||||||||||||||
| Gene expression | ||||||||||||||||||||||||||||||||||
| All samples | [Expression pattern for all samples] | |||||||||||||||||||||||||||||||||
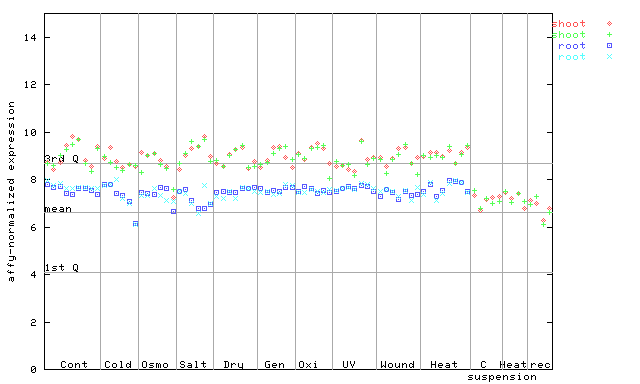
| AtGenExpress* (Development) |
251151_at
X axis is samples (pdf file), and Y axis is log2-expression. |
|||||||||||||||||||||||||||||||||
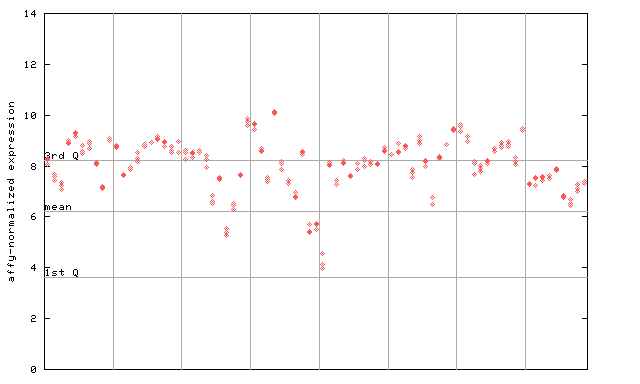
| AtGenExpress* (Stress) |
251151_at
X axis is samples (pdf file), and Y axis is log2-expression. |
|||||||||||||||||||||||||||||||||
| AtGenExpress* (Hormone) |
251151_at
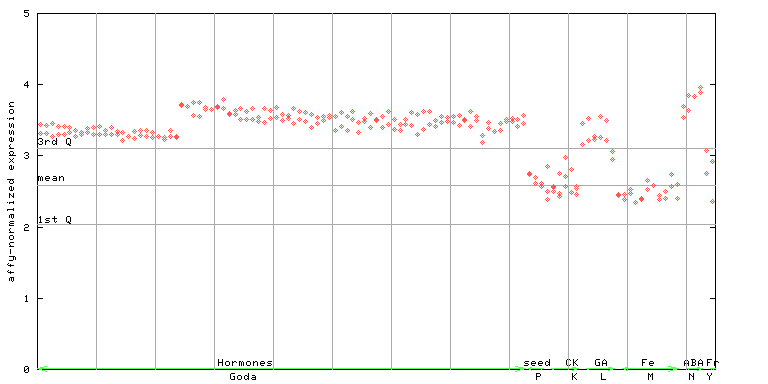
X axis is samples (xls file), and Y axis is log-expression. |
|||||||||||||||||||||||||||||||||


")
| Link to other DBs | ||
| Entrez Gene ID | 825492 |
|
| Refseq ID (protein) | NP_567140.1 | |
The preparation time of this page was 0.2 [sec].