[←][→] ath
| functional annotation | ||||||||||||||||||||||||||||||||||||||||||||||||
| Function | Flavin containing amine oxidoreductase family |


|
||||||||||||||||||||||||||||||||||||||||||||||
| GO BP |
|
|||||||||||||||||||||||||||||||||||||||||||||||
| GO CC |
|
|||||||||||||||||||||||||||||||||||||||||||||||
| GO MF |
|
|||||||||||||||||||||||||||||||||||||||||||||||
| KEGG | ath00860 [list] [network] Porphyrin metabolism (53 genes) |  |
||||||||||||||||||||||||||||||||||||||||||||||
| ath01240 [list] [network] Biosynthesis of cofactors (236 genes) | |
|||||||||||||||||||||||||||||||||||||||||||||||
| Protein | NP_192078.1 NP_849283.1 | |||||||||||||||||||||||||||||||||||||||||||||||
| BLAST | NP_192078.1 NP_849283.1 | |||||||||||||||||||||||||||||||||||||||||||||||
| Orthologous | [Ortholog page] LOC4327918 (osa) LOC7460503 (ppo) LOC7486839 (ppo) LOC25484740 (mtr) LOC100810190 (gma) LOC101259974 (sly) LOC103844594 (bra) LOC123102202 (tae) LOC123110370 (tae) LOC123119396 (tae) LOC123397776 (hvu) | |||||||||||||||||||||||||||||||||||||||||||||||
| Subcellular localization wolf |
|
|||||||||||||||||||||||||||||||||||||||||||||||
| Subcellular localization TargetP |
|
|||||||||||||||||||||||||||||||||||||||||||||||
| Gene coexpression | ||||||||||||||||||||||||||||||||||||||||||||||||
| Network*for coexpressed genes |
|
|||||||||||||||||||||||||||||||||||||||||||||||
|---|---|---|---|---|---|---|---|---|---|---|---|---|---|---|---|---|---|---|---|---|---|---|---|---|---|---|---|---|---|---|---|---|---|---|---|---|---|---|---|---|---|---|---|---|---|---|---|---|
| Coexpressed gene list |
[Coexpressed gene list for PPOX] | |||||||||||||||||||||||||||||||||||||||||||||||
| Gene expression | ||||||||||||||||||||||||||||||||||||||||||||||||
| All samples | [Expression pattern for all samples] | |||||||||||||||||||||||||||||||||||||||||||||||
| AtGenExpress* (Development) |
255537_at
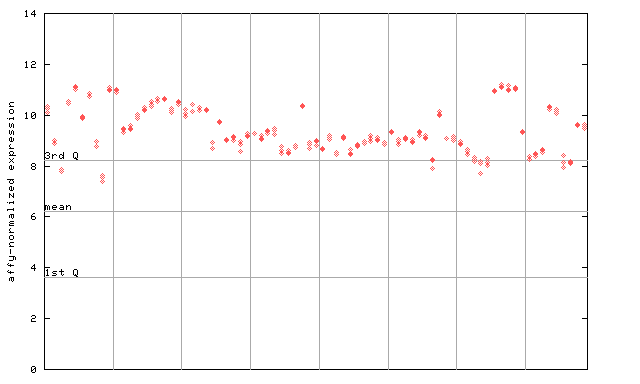
X axis is samples (pdf file), and Y axis is log2-expression. |
|||||||||||||||||||||||||||||||||||||||||||||||
| AtGenExpress* (Stress) |
255537_at
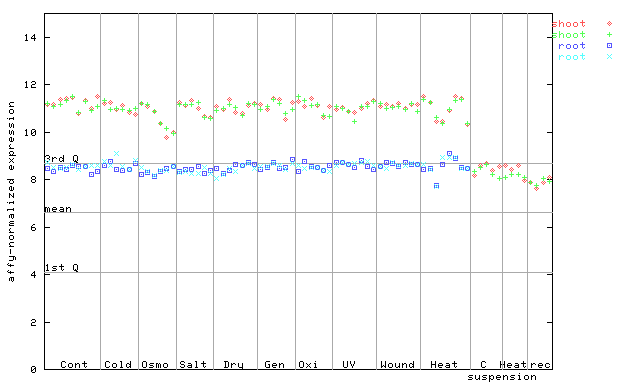
X axis is samples (pdf file), and Y axis is log2-expression. |
|||||||||||||||||||||||||||||||||||||||||||||||
| AtGenExpress* (Hormone) |
255537_at
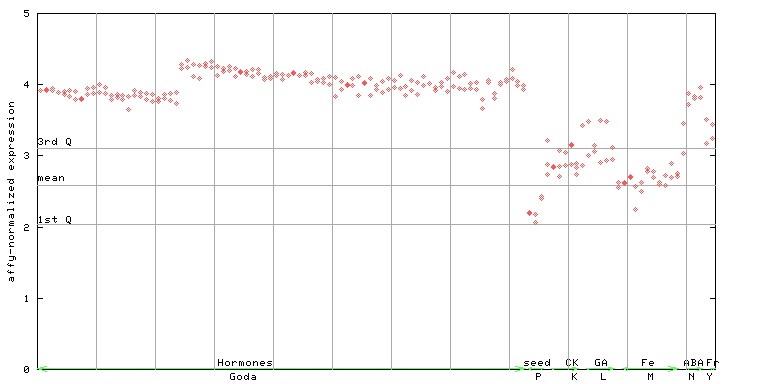
X axis is samples (xls file), and Y axis is log-expression. |
|||||||||||||||||||||||||||||||||||||||||||||||


")
")
| Link to other DBs | ||
| Entrez Gene ID | 827991 |
|
| Refseq ID (protein) | NP_192078.1 | |
| NP_849283.1 | |
|
The preparation time of this page was 0.1 [sec].