[←][→] ath
| functional annotation | |||||||||||||||||||||||||||||||||||||||
| Function | glycosyl hydrolase 9B13 |


|
|||||||||||||||||||||||||||||||||||||
| GO BP |
|
||||||||||||||||||||||||||||||||||||||
| GO CC |
|
||||||||||||||||||||||||||||||||||||||
| GO MF |
|
||||||||||||||||||||||||||||||||||||||
| KEGG | |||||||||||||||||||||||||||||||||||||||
| Protein | NP_001328883.1 NP_192138.1 | ||||||||||||||||||||||||||||||||||||||
| BLAST | NP_001328883.1 NP_192138.1 | ||||||||||||||||||||||||||||||||||||||
| Orthologous | [Ortholog page] cellulase (sly) CEL2 (ath) LOC4327286 (osa) LOC7491288 (ppo) LOC11410209 (mtr) LOC25499614 (mtr) LOC100232904 (vvi) LOC100285091 (zma) CEL7 (gma) LOC100789144 (gma) LOC100793900 (gma) LOC103836761 (bra) LOC103843735 (bra) LOC103868221 (bra) LOC109939707 (zma) | ||||||||||||||||||||||||||||||||||||||
| Subcellular localization wolf |
|
||||||||||||||||||||||||||||||||||||||
| Subcellular localization TargetP |
|
||||||||||||||||||||||||||||||||||||||
| Gene coexpression | |||||||||||||||||||||||||||||||||||||||
| Network*for coexpressed genes |
|
||||||||||||||||||||||||||||||||||||||
|---|---|---|---|---|---|---|---|---|---|---|---|---|---|---|---|---|---|---|---|---|---|---|---|---|---|---|---|---|---|---|---|---|---|---|---|---|---|---|---|
| Coexpressed gene list |
[Coexpressed gene list for GH9B13] | ||||||||||||||||||||||||||||||||||||||
| Gene expression | |||||||||||||||||||||||||||||||||||||||
| All samples | [Expression pattern for all samples] | ||||||||||||||||||||||||||||||||||||||
| AtGenExpress* (Development) |
255517_at
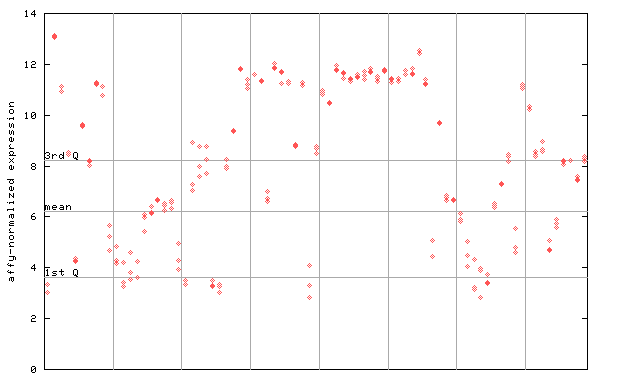
X axis is samples (pdf file), and Y axis is log2-expression. |
||||||||||||||||||||||||||||||||||||||
| AtGenExpress* (Stress) |
255517_at
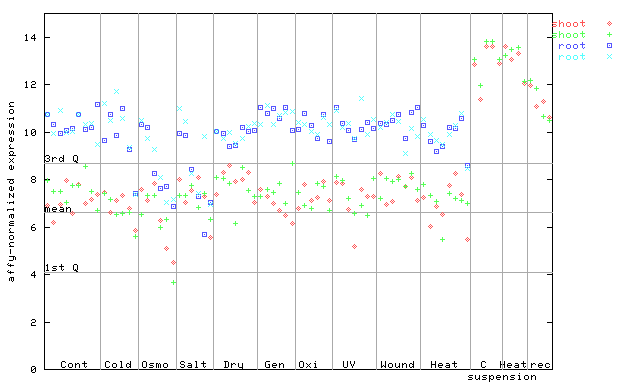
X axis is samples (pdf file), and Y axis is log2-expression. |
||||||||||||||||||||||||||||||||||||||
| AtGenExpress* (Hormone) |
255517_at
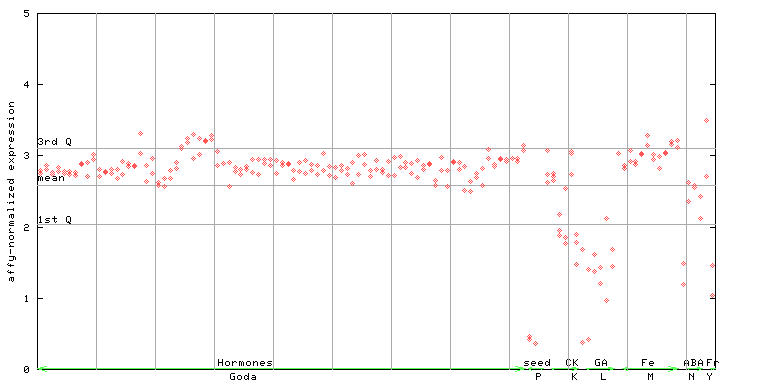
X axis is samples (xls file), and Y axis is log-expression. |
||||||||||||||||||||||||||||||||||||||


")
| Link to other DBs | ||
| Entrez Gene ID | 828080 |
|
| Refseq ID (protein) | NP_001328883.1 | |
| NP_192138.1 | |
|
The preparation time of this page was 0.2 [sec].