[←][→] ath
| functional annotation | |||||||||||||||||||||||||||||||
| Function | GTP-binding family protein |

 Plant GARDEN Plant GARDEN JBrowse
|
|||||||||||||||||||||||||||||
| GO BP |
|
||||||||||||||||||||||||||||||
| GO CC |
|
||||||||||||||||||||||||||||||
| GO MF |
|
||||||||||||||||||||||||||||||
| KEGG | |||||||||||||||||||||||||||||||
| Protein | NP_192188.2 | ||||||||||||||||||||||||||||||
| BLAST | NP_192188.2 | ||||||||||||||||||||||||||||||
| Orthologous | [Ortholog page] LOC4338877 (osa) LOC7464836 (ppo) LOC25499117 (mtr) LOC100784201 (gma) LOC100797224 (gma) LOC101252093 (sly) LOC103858739 (bra) LOC123057053 (tae) LOC123134434 (tae) LOC123182121 (tae) LOC123446401 (hvu) | ||||||||||||||||||||||||||||||
| Subcellular localization wolf |
|
||||||||||||||||||||||||||||||
| Subcellular localization TargetP |
|
||||||||||||||||||||||||||||||
| Gene coexpression | |||||||||||||||||||||||||||||||
| Network*for coexpressed genes |
|
||||||||||||||||||||||||||||||
|---|---|---|---|---|---|---|---|---|---|---|---|---|---|---|---|---|---|---|---|---|---|---|---|---|---|---|---|---|---|---|---|
| Coexpressed gene list |
[Coexpressed gene list for EMB3129] | ||||||||||||||||||||||||||||||
| Gene expression | |||||||||||||||||||||||||||||||
| All samples | [Expression pattern for all samples] | ||||||||||||||||||||||||||||||
| AtGenExpress* (Development) |
255447_at
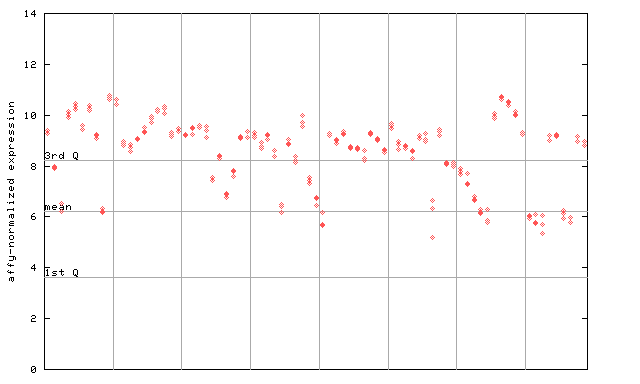
X axis is samples (pdf file), and Y axis is log2-expression. |
||||||||||||||||||||||||||||||
| AtGenExpress* (Stress) |
255447_at
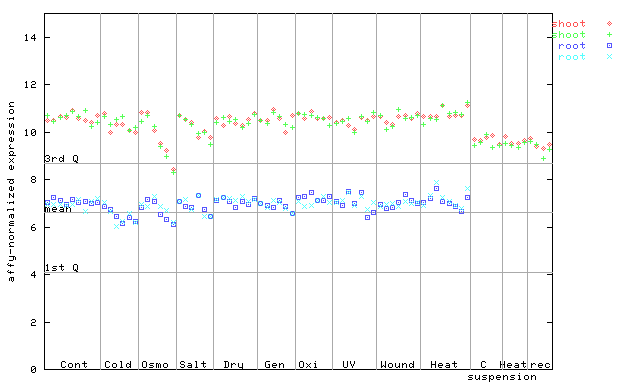
X axis is samples (pdf file), and Y axis is log2-expression. |
||||||||||||||||||||||||||||||
| AtGenExpress* (Hormone) |
255447_at
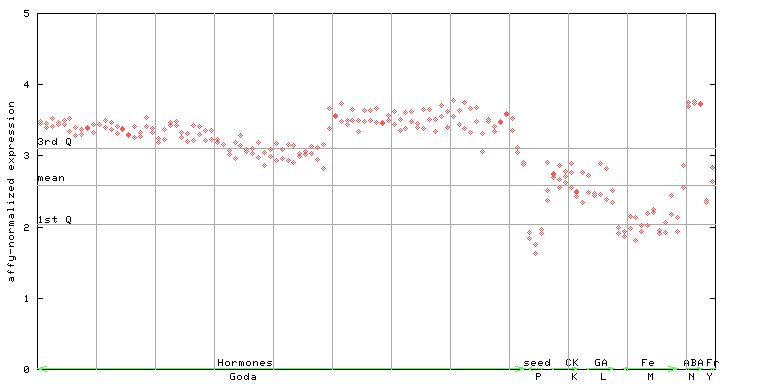
X axis is samples (xls file), and Y axis is log-expression. |
||||||||||||||||||||||||||||||


| Link to other DBs | ||
| Entrez Gene ID | 828174 |
|
| Refseq ID (protein) | NP_192188.2 | |
The preparation time of this page was 0.6 [sec].