[←][→] ath
| functional annotation | |||||||||||||||||||||||||||||||
| Function | xyloglucan endotransglucosylase/hydrolase 9 |


|
|||||||||||||||||||||||||||||
| GO BP |
|
||||||||||||||||||||||||||||||
| GO CC |
|
||||||||||||||||||||||||||||||
| GO MF |
|
||||||||||||||||||||||||||||||
| KEGG | |||||||||||||||||||||||||||||||
| Protein | NP_001031581.1 NP_192230.1 | ||||||||||||||||||||||||||||||
| BLAST | NP_001031581.1 NP_192230.1 | ||||||||||||||||||||||||||||||
| Orthologous | [Ortholog page] XTH16 (sly) LOC7464712 (ppo) LOC7498139 (ppo) LOC11416050 (mtr) LOC25492050 (mtr) LOC100527891 (gma) LOC100785982 (gma) LOC100786906 (gma) LOC100801567 (gma) LOC101257347 (sly) XTH1 (bra) LOC103858712 (bra) | ||||||||||||||||||||||||||||||
| Subcellular localization wolf |
|
||||||||||||||||||||||||||||||
| Subcellular localization TargetP |
|
||||||||||||||||||||||||||||||
| Gene coexpression | |||||||||||||||||||||||||||||||
| Network*for coexpressed genes |
|
||||||||||||||||||||||||||||||
|---|---|---|---|---|---|---|---|---|---|---|---|---|---|---|---|---|---|---|---|---|---|---|---|---|---|---|---|---|---|---|---|
| Coexpressed gene list |
[Coexpressed gene list for XTH9] | ||||||||||||||||||||||||||||||
| Gene expression | |||||||||||||||||||||||||||||||
| All samples | [Expression pattern for all samples] | ||||||||||||||||||||||||||||||
| AtGenExpress* (Development) |
255433_at
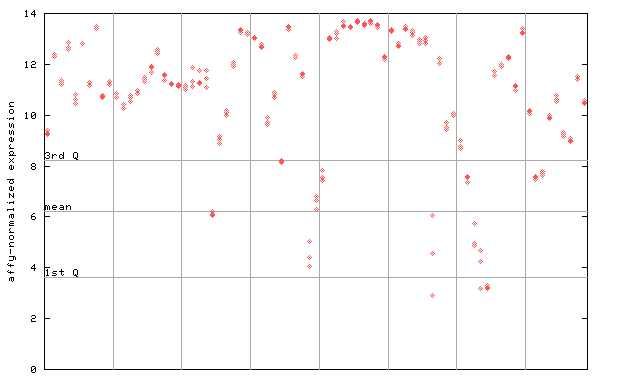
X axis is samples (pdf file), and Y axis is log2-expression. |
||||||||||||||||||||||||||||||
| AtGenExpress* (Stress) |
255433_at
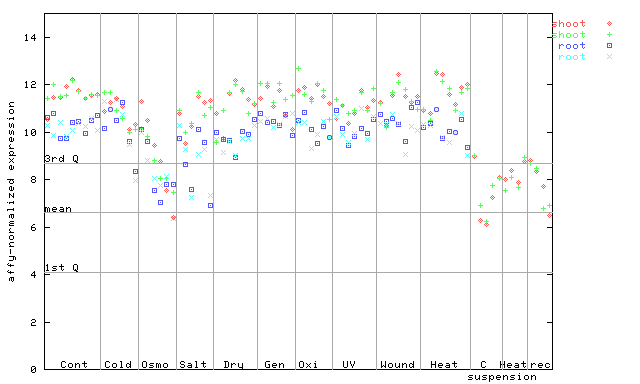
X axis is samples (pdf file), and Y axis is log2-expression. |
||||||||||||||||||||||||||||||
| AtGenExpress* (Hormone) |
255433_at
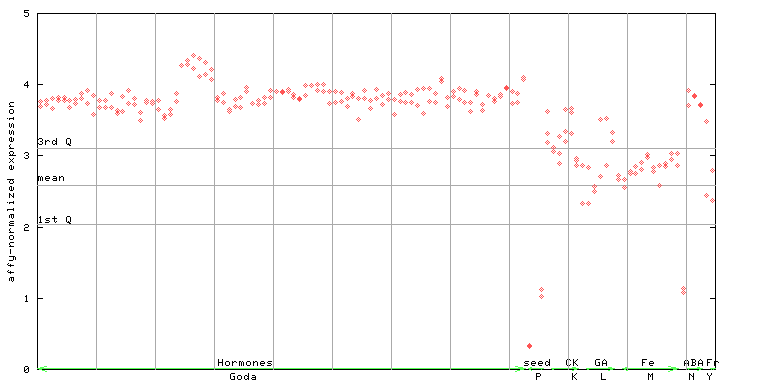
X axis is samples (xls file), and Y axis is log-expression. |
||||||||||||||||||||||||||||||


| Link to other DBs | ||
| Entrez Gene ID | 828024 |
|
| Refseq ID (protein) | NP_001031581.1 | |
| NP_192230.1 | |
|
The preparation time of this page was 0.1 [sec].