| functional annotation |
| Function |
glucan synthase-like 5 |


|
| GO BP |
|
GO:0006075 [list] [network] (1->3)-beta-D-glucan biosynthetic process
|
(12 genes)
|
IEA
|
 |
|
GO:0009870 [list] [network] defense response signaling pathway, resistance gene-dependent
|
(15 genes)
|
IMP
|
|
|
GO:0052544 [list] [network] defense response by callose deposition in cell wall
|
(16 genes)
|
IMP
|
|
|
GO:0052542 [list] [network] defense response by callose deposition
|
(19 genes)
|
IMP
|
|
|
GO:0008360 [list] [network] regulation of cell shape
|
(34 genes)
|
IEA
|
|
|
GO:0009863 [list] [network] salicylic acid mediated signaling pathway
|
(42 genes)
|
IEP
|
|
|
GO:0009965 [list] [network] leaf morphogenesis
|
(96 genes)
|
IMP
|
|
|
GO:0010150 [list] [network] leaf senescence
|
(111 genes)
|
IMP
|
|
|
GO:0009555 [list] [network] pollen development
|
(337 genes)
|
IGI
|
|
|
GO:0042742 [list] [network] defense response to bacterium
|
(399 genes)
|
IMP
|
|
|
GO:0050832 [list] [network] defense response to fungus
|
(517 genes)
|
IMP
|
|
|
GO:0009620 [list] [network] response to fungus
|
(595 genes)
|
IMP
|
|
|
GO:0006952 [list] [network] defense response
|
(1420 genes)
|
IMP
|
|
|
GO:0000003 [list] [network] reproduction
|
(1767 genes)
|
IGI
|
|
|
| GO CC |
|
GO:0000148 [list] [network] 1,3-beta-D-glucan synthase complex
|
(12 genes)
|
IEA
|
|
|
GO:0009506 [list] [network] plasmodesma
|
(962 genes)
|
IDA
|
|
|
GO:0005794 [list] [network] Golgi apparatus
|
(1430 genes)
|
IDA
|
|
|
GO:0005886 [list] [network] plasma membrane
|
(3771 genes)
|
IDA
|
|
|
GO:0005739 [list] [network] mitochondrion
|
(4405 genes)
|
ISM
|
|
|
GO:0016021 [list] [network] integral component of membrane
|
(4803 genes)
|
IEA
|
|
|
| GO MF |
|
GO:0003843 [list] [network] 1,3-beta-D-glucan synthase activity
|
(12 genes)
|
IEA
ISS
|
|
|
GO:0016757 [list] [network] transferase activity, transferring glycosyl groups
|
(644 genes)
|
ISS
|
|
|
| KEGG |
|
|
| Protein |
NP_192264.1
|
| BLAST |
NP_192264.1
|
| Orthologous |
[Ortholog page]
GSL1 (ath)
LOC4325131 (osa)
LOC4325900 (osa)
LOC11440682 (mtr)
LOC25485938 (mtr)
LOC25487659 (mtr)
LOC100242010 (vvi)
LOC100263390 (vvi)
LOC100806685 (gma)
LOC100812250 (gma)
LOC101243903 (sly)
LOC101249601 (sly)
LOC103651198 (zma)
LOC103651372 (zma)
LOC103839788 (bra)
LOC103846566 (bra)
|
Subcellular
localization
wolf |
|
plas 8,
mito 1,
E.R. 1,
pero 1
|
(predict for NP_192264.1)
|
|
Subcellular
localization
TargetP |
|
other 7,
mito 4
|
(predict for NP_192264.1)
|
|
| Gene coexpression |
Network*for
coexpressed
genes |
| KEGG* ID |
Title |
#genes |
Link to the KEGG* map
(Multiple genes) |
| ath04144 |
Endocytosis |
4 |
") |
| ath04120 |
Ubiquitin mediated proteolysis |
2 |
") |
Genes directly connected with GSL05 on the network
| coex z* |
Locus |
Function* |
Coexpression
detail |
Entrez Gene ID* |
| 11.0 |
AT3G11130 |
Clathrin, heavy chain |
[detail] |
820284 |
| 10.1 |
GSL8 |
glucan synthase-like 8 |
[detail] |
818258 |
| 8.8 |
GSL10 |
glucan synthase-like 10 |
[detail] |
819903 |
|
Coexpressed
gene list |
[Coexpressed gene list for GSL05]
|
| Gene expression |
| All samples |
[Expression pattern for all samples]
|
AtGenExpress*
(Development) |
255378_at
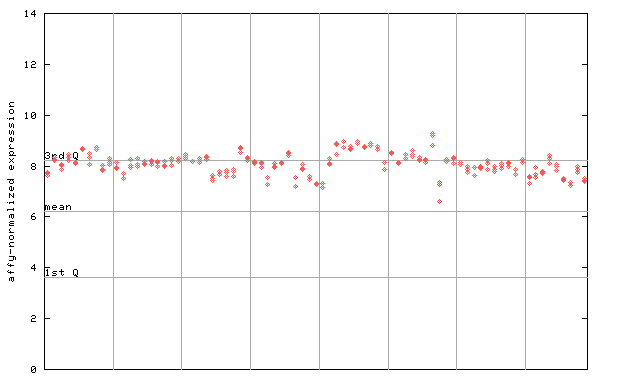
X axis is samples (pdf file), and Y axis is log2-expression.
"1st Q", "mean" and "3rd Q" indecate the values for all genes on a GeneChip. Q: quartile.
|
AtGenExpress*
(Stress) |
255378_at
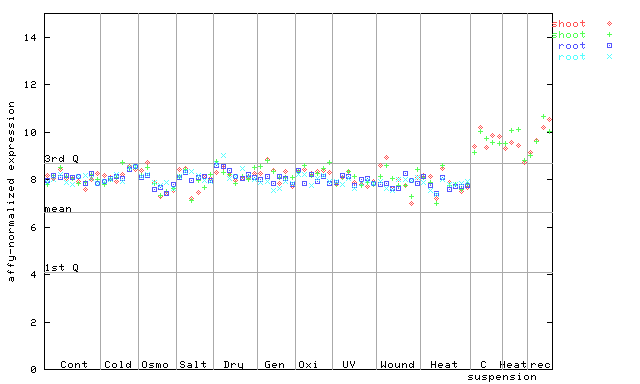
X axis is samples (pdf file), and Y axis is log2-expression.
|
AtGenExpress*
(Hormone) |
255378_at
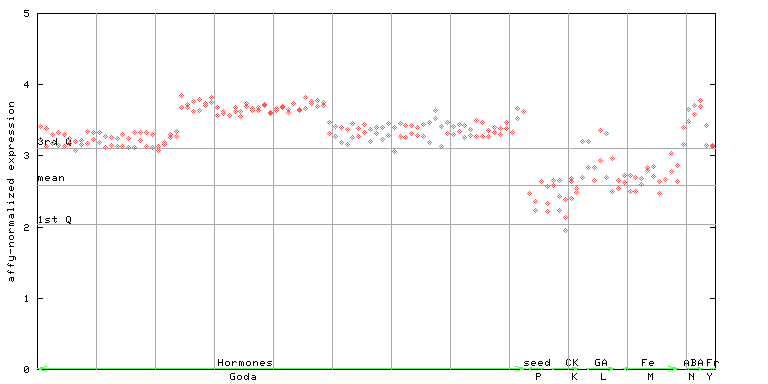
X axis is samples (xls file), and Y axis is log-expression.
|
