[←][→] ath
| functional annotation | ||||||||||||||||||||||||||
| Function | Inositol monophosphatase family protein |


|
||||||||||||||||||||||||
| GO BP |
|
|||||||||||||||||||||||||
| GO CC |
|
|||||||||||||||||||||||||
| GO MF |
|
|||||||||||||||||||||||||
| KEGG | ath00920 [list] [network] Sulfur metabolism (42 genes) |  |
||||||||||||||||||||||||
| Protein | NP_001328993.1 NP_192418.1 | |||||||||||||||||||||||||
| BLAST | NP_001328993.1 NP_192418.1 | |||||||||||||||||||||||||
| Orthologous | [Ortholog page] LOC4343581 (osa) LOC4343582 (osa) LOC7490778 (ppo) LOC25485918 (mtr) LOC100192833 (zma) LOC100780695 (gma) LOC100854808 (vvi) LOC101251056 (sly) LOC101251352 (sly) LOC103839775 (bra) | |||||||||||||||||||||||||
| Subcellular localization wolf |
|
|||||||||||||||||||||||||
| Subcellular localization TargetP |
|
|||||||||||||||||||||||||
| Gene coexpression | ||||||||||||||||||||||||||
| Network*for coexpressed genes |
|
|||||||||||||||||||||||||
|---|---|---|---|---|---|---|---|---|---|---|---|---|---|---|---|---|---|---|---|---|---|---|---|---|---|---|
| Coexpressed gene list |
[Coexpressed gene list for AT4G05090] | |||||||||||||||||||||||||
| Gene expression | ||||||||||||||||||||||||||
| All samples | [Expression pattern for all samples] | |||||||||||||||||||||||||
| AtGenExpress* (Development) |
255249_at
X axis is samples (pdf file), and Y axis is log2-expression. |
|||||||||||||||||||||||||
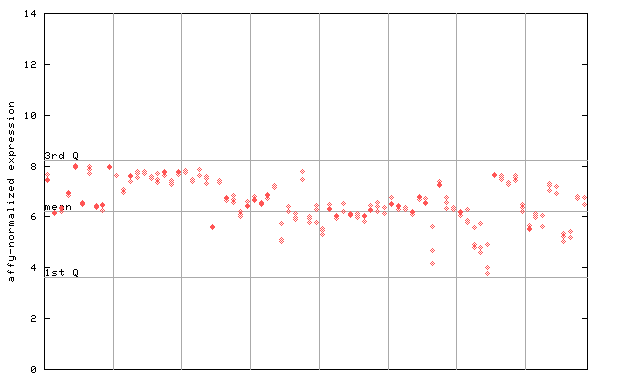
| AtGenExpress* (Stress) |
255249_at

X axis is samples (pdf file), and Y axis is log2-expression. |
|||||||||||||||||||||||||
| AtGenExpress* (Hormone) |
255249_at
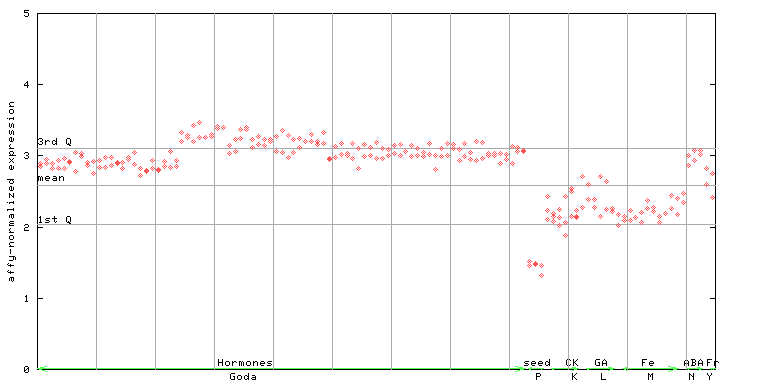
X axis is samples (xls file), and Y axis is log-expression. |
|||||||||||||||||||||||||


| Link to other DBs | ||
| Entrez Gene ID | 825853 |
|
| Refseq ID (protein) | NP_001328993.1 | |
| NP_192418.1 | |
|
The preparation time of this page was 0.2 [sec].