[←][→] ath
| functional annotation | |||||||||||||||||||||||||||||||||||||||
| Function | glycine-rich protein |


|
|||||||||||||||||||||||||||||||||||||
| GO BP |
|
||||||||||||||||||||||||||||||||||||||
| GO CC |
|
||||||||||||||||||||||||||||||||||||||
| GO MF |
|
||||||||||||||||||||||||||||||||||||||
| KEGG | |||||||||||||||||||||||||||||||||||||||
| Protein | NP_001190688.1 NP_192563.2 | ||||||||||||||||||||||||||||||||||||||
| BLAST | NP_001190688.1 NP_192563.2 | ||||||||||||||||||||||||||||||||||||||
| Orthologous | [Ortholog page] LOC4332336 (osa) LOC7469137 (ppo) LOC11425814 (mtr) LOC100250629 (vvi) LOC100276509 (zma) LOC100277047 (zma) LOC100500441 (gma) LOC100526958 (gma) LOC101250268 (sly) LOC103858473 (bra) | ||||||||||||||||||||||||||||||||||||||
| Subcellular localization wolf |
|
||||||||||||||||||||||||||||||||||||||
| Subcellular localization TargetP |
|
||||||||||||||||||||||||||||||||||||||
| Gene coexpression | |||||||||||||||||||||||||||||||||||||||
| Network*for coexpressed genes |
|
||||||||||||||||||||||||||||||||||||||
|---|---|---|---|---|---|---|---|---|---|---|---|---|---|---|---|---|---|---|---|---|---|---|---|---|---|---|---|---|---|---|---|---|---|---|---|---|---|---|---|
| Coexpressed gene list |
[Coexpressed gene list for AT4G08230] | ||||||||||||||||||||||||||||||||||||||
| Gene expression | |||||||||||||||||||||||||||||||||||||||
| All samples | [Expression pattern for all samples] | ||||||||||||||||||||||||||||||||||||||
| AtGenExpress* (Development) |
255155_at
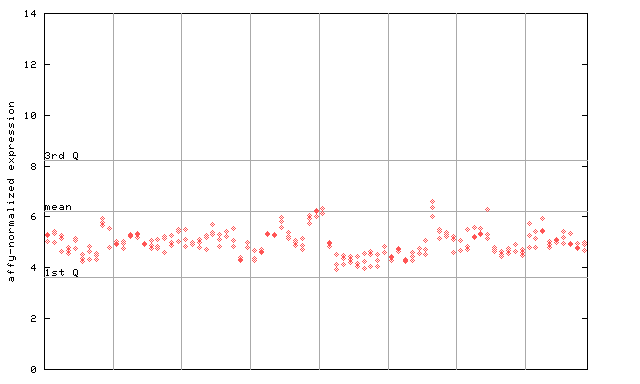
X axis is samples (pdf file), and Y axis is log2-expression. |
||||||||||||||||||||||||||||||||||||||
| AtGenExpress* (Stress) |
255155_at
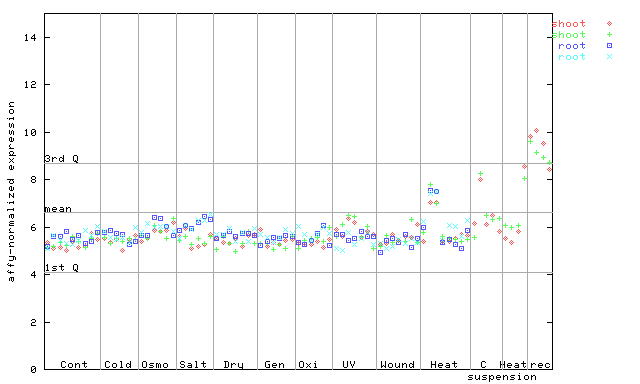
X axis is samples (pdf file), and Y axis is log2-expression. |
||||||||||||||||||||||||||||||||||||||
| AtGenExpress* (Hormone) |
255155_at
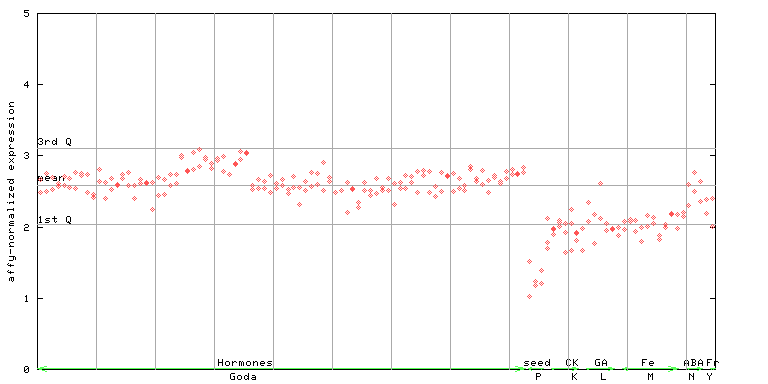
X axis is samples (xls file), and Y axis is log-expression. |
||||||||||||||||||||||||||||||||||||||


")
| Link to other DBs | ||
| Entrez Gene ID | 826373 |
|
| Refseq ID (protein) | NP_001190688.1 | |
| NP_192563.2 | |
|
The preparation time of this page was 0.2 [sec].