[←][→] ath
| functional annotation | ||||||||||||||||||||||||||||||||||||||||||||||||||||
| Function | ascorbate peroxidase 4 |


|
||||||||||||||||||||||||||||||||||||||||||||||||||
| GO BP |
|
|||||||||||||||||||||||||||||||||||||||||||||||||||
| GO CC |
|
|||||||||||||||||||||||||||||||||||||||||||||||||||
| GO MF |
|
|||||||||||||||||||||||||||||||||||||||||||||||||||
| KEGG | ath00053 [list] [network] Ascorbate and aldarate metabolism (63 genes) |  |
||||||||||||||||||||||||||||||||||||||||||||||||||
| ath00480 [list] [network] Glutathione metabolism (103 genes) | |
|||||||||||||||||||||||||||||||||||||||||||||||||||
| Protein | NP_001329836.1 NP_001329837.1 NP_192640.1 | |||||||||||||||||||||||||||||||||||||||||||||||||||
| BLAST | NP_001329836.1 NP_001329837.1 NP_192640.1 | |||||||||||||||||||||||||||||||||||||||||||||||||||
| Orthologous | [Ortholog page] LOC4336886 (osa) LOC7468886 (ppo) LOC11437370 (mtr) LOC100795192 (gma) LOC100799504 (gma) LOC101263901 (sly) LOC103858501 (bra) LOC123046551 (tae) LOC123054409 (tae) LOC123190287 (tae) LOC123427722 (hvu) | |||||||||||||||||||||||||||||||||||||||||||||||||||
| Subcellular localization wolf |
|
|||||||||||||||||||||||||||||||||||||||||||||||||||
| Subcellular localization TargetP |
|
|||||||||||||||||||||||||||||||||||||||||||||||||||
| Gene coexpression | ||||||||||||||||||||||||||||||||||||||||||||||||||||
| Network*for coexpressed genes |
|
|||||||||||||||||||||||||||||||||||||||||||||||||||
|---|---|---|---|---|---|---|---|---|---|---|---|---|---|---|---|---|---|---|---|---|---|---|---|---|---|---|---|---|---|---|---|---|---|---|---|---|---|---|---|---|---|---|---|---|---|---|---|---|---|---|---|---|
| Coexpressed gene list |
[Coexpressed gene list for TL29] | |||||||||||||||||||||||||||||||||||||||||||||||||||
| Gene expression | ||||||||||||||||||||||||||||||||||||||||||||||||||||
| All samples | [Expression pattern for all samples] | |||||||||||||||||||||||||||||||||||||||||||||||||||
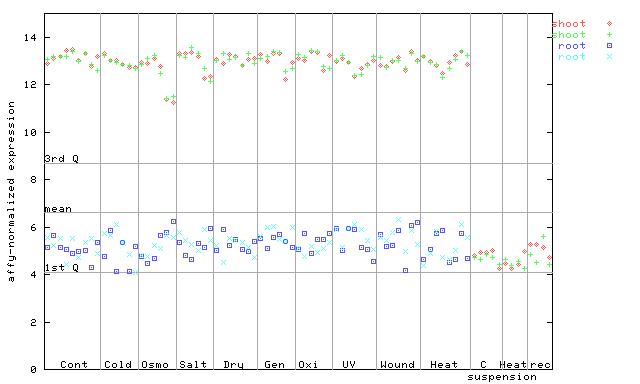
| AtGenExpress* (Development) |
255078_at
X axis is samples (pdf file), and Y axis is log2-expression. |
|||||||||||||||||||||||||||||||||||||||||||||||||||
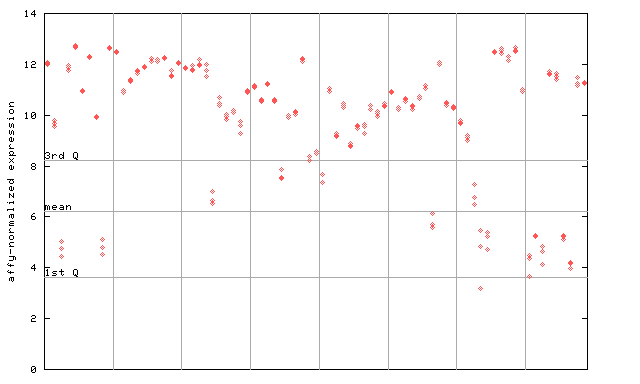
| AtGenExpress* (Stress) |
255078_at
X axis is samples (pdf file), and Y axis is log2-expression. |
|||||||||||||||||||||||||||||||||||||||||||||||||||
| AtGenExpress* (Hormone) |
255078_at
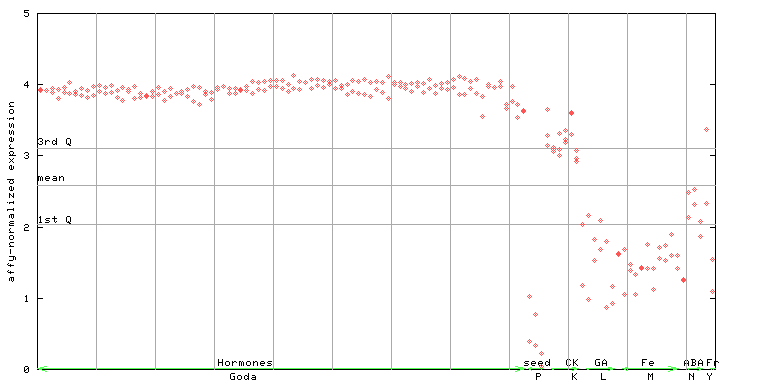
X axis is samples (xls file), and Y axis is log-expression. |
|||||||||||||||||||||||||||||||||||||||||||||||||||


")
")
")
| Link to other DBs | ||
| Entrez Gene ID | 826480 |
|
| Refseq ID (protein) | NP_001329836.1 | |
| NP_001329837.1 | |
|
| NP_192640.1 | |
|
The preparation time of this page was 0.1 [sec].