[←][→] ath
| functional annotation | ||||||||||
| Function | SNARE associated Golgi protein family |


|
||||||||
| GO BP |
|
|||||||||
| GO CC |
|
|||||||||
| GO MF |
|
|||||||||
| KEGG | ||||||||||
| Protein | NP_192696.3 | |||||||||
| BLAST | NP_192696.3 | |||||||||
| Orthologous | [Ortholog page] AT1G71940 (ath) LOC4333847 (osa) LOC7475803 (ppo) LOC25484970 (mtr) LOC100252172 (vvi) LOC100283054 (zma) LOC100789661 (gma) LOC100796212 (gma) LOC101245315 (sly) LOC101250311 (sly) LOC103830822 (bra) LOC103831707 (bra) LOC103838835 (bra) | |||||||||
| Subcellular localization wolf |
|
|||||||||
| Subcellular localization TargetP |
|
|||||||||
| Gene coexpression | ||||||||||
| Network*for coexpressed genes |
||||||||||
|---|---|---|---|---|---|---|---|---|---|---|
| Coexpressed gene list |
[Coexpressed gene list for AT4G09580] | |||||||||
| Gene expression | ||||||||||
| All samples | [Expression pattern for all samples] | |||||||||
| AtGenExpress* (Development) |
255040_at
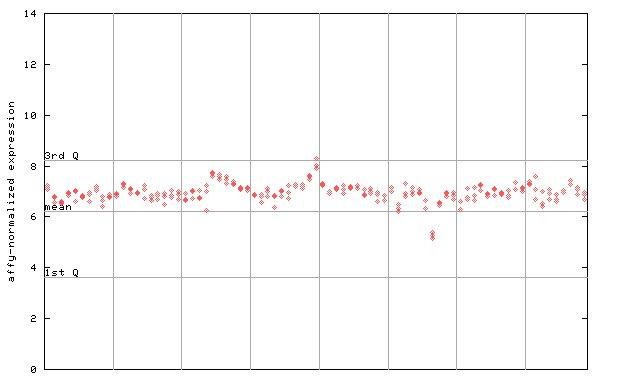
X axis is samples (pdf file), and Y axis is log2-expression. |
|||||||||
| AtGenExpress* (Stress) |
255040_at
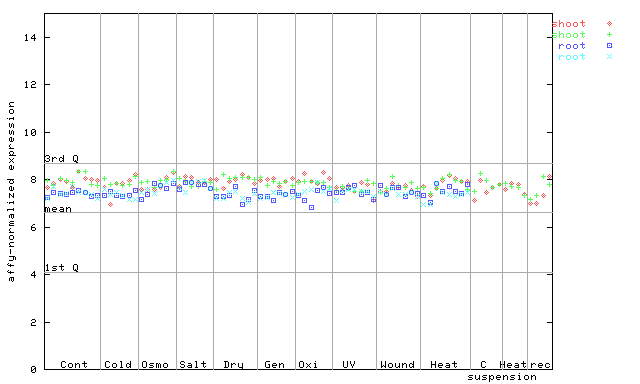
X axis is samples (pdf file), and Y axis is log2-expression. |
|||||||||
| AtGenExpress* (Hormone) |
255040_at
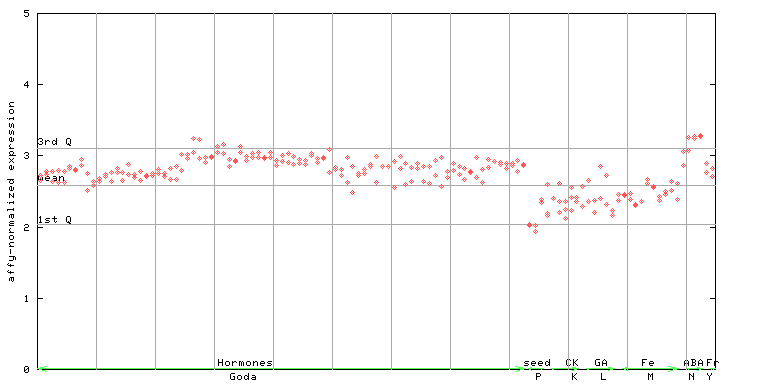
X axis is samples (xls file), and Y axis is log-expression. |
|||||||||


| Link to other DBs | ||
| Entrez Gene ID | 826542 |
|
| Refseq ID (protein) | NP_192696.3 | |
The preparation time of this page was 0.2 [sec].