[←][→] ath
| functional annotation | ||||||||||||||||||||||||||
| Function | GAR2-like protein |


|
||||||||||||||||||||||||
| GO BP |
|
|||||||||||||||||||||||||
| GO CC |
|
|||||||||||||||||||||||||
| GO MF |
|
|||||||||||||||||||||||||
| KEGG | ||||||||||||||||||||||||||
| Protein | NP_192915.1 | |||||||||||||||||||||||||
| BLAST | NP_192915.1 | |||||||||||||||||||||||||
| Orthologous | [Ortholog page] TRM9 (ath) TRM11 (ath) LOC7461740 (ppo) LOC7464907 (ppo) LOC7490919 (ppo) LOC18097033 (ppo) LOC25493647 (mtr) LOC25500962 (mtr) LOC100802653 (gma) TRM9 (sly) TRM10/11 (sly) LOC102659854 (gma) LOC102661341 (gma) LOC102663212 (gma) LOC102668195 (gma) LOC103847898 (bra) LOC103853505 (bra) LOC103858849 (bra) LOC103860717 (bra) | |||||||||||||||||||||||||
| Subcellular localization wolf |
|
|||||||||||||||||||||||||
| Subcellular localization TargetP |
|
|||||||||||||||||||||||||
| Gene coexpression | ||||||||||||||||||||||||||
| Network*for coexpressed genes |
|
|||||||||||||||||||||||||
|---|---|---|---|---|---|---|---|---|---|---|---|---|---|---|---|---|---|---|---|---|---|---|---|---|---|---|
| Coexpressed gene list |
[Coexpressed gene list for TRM10] | |||||||||||||||||||||||||
| Gene expression | ||||||||||||||||||||||||||
| All samples | [Expression pattern for all samples] | |||||||||||||||||||||||||
| AtGenExpress* (Development) |
254888_at
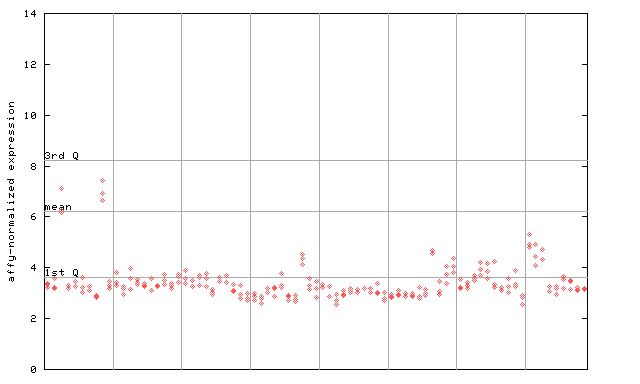
X axis is samples (pdf file), and Y axis is log2-expression. |
|||||||||||||||||||||||||
| AtGenExpress* (Stress) |
254888_at
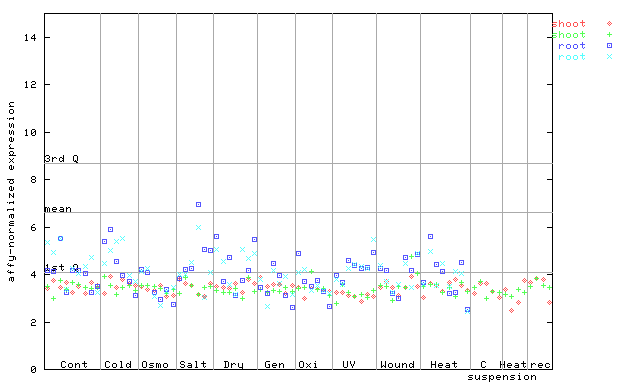
X axis is samples (pdf file), and Y axis is log2-expression. |
|||||||||||||||||||||||||
| AtGenExpress* (Hormone) |
254888_at
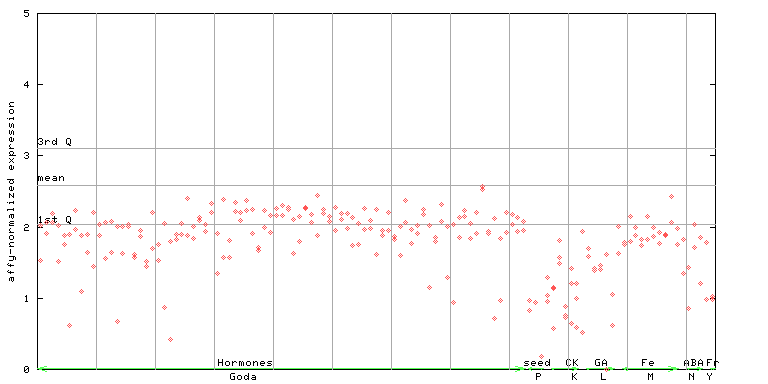
X axis is samples (xls file), and Y axis is log-expression. |
|||||||||||||||||||||||||


| Link to other DBs | ||
| Entrez Gene ID | 826784 |
|
| Refseq ID (protein) | NP_192915.1 | |
The preparation time of this page was 0.1 [sec].