[←][→] ath
| functional annotation | |||||||||||||||||||||||||||||||||||||||||
| Function | putative triglyceride lipase |


|
|||||||||||||||||||||||||||||||||||||||
| GO BP |
|
||||||||||||||||||||||||||||||||||||||||
| GO CC |
|
||||||||||||||||||||||||||||||||||||||||
| GO MF |
|
||||||||||||||||||||||||||||||||||||||||
| KEGG | |||||||||||||||||||||||||||||||||||||||||
| Protein | NP_001319920.1 NP_001328226.1 NP_001328227.1 | ||||||||||||||||||||||||||||||||||||||||
| BLAST | NP_001319920.1 NP_001328226.1 NP_001328227.1 | ||||||||||||||||||||||||||||||||||||||||
| Orthologous | [Ortholog page] LOC4336360 (osa) LOC11421212 (mtr) LOC18102455 (ppo) LOC100777995 (gma) LOC100789825 (gma) LOC101247860 (sly) LOC103863624 (bra) LOC123046002 (tae) LOC123053875 (tae) LOC123189744 (tae) LOC123427213 (hvu) | ||||||||||||||||||||||||||||||||||||||||
| Subcellular localization wolf |
|
||||||||||||||||||||||||||||||||||||||||
| Subcellular localization TargetP |
|
||||||||||||||||||||||||||||||||||||||||
| Gene coexpression | |||||||||||||||||||||||||||||||||||||||||
| Network*for coexpressed genes |
|
||||||||||||||||||||||||||||||||||||||||
|---|---|---|---|---|---|---|---|---|---|---|---|---|---|---|---|---|---|---|---|---|---|---|---|---|---|---|---|---|---|---|---|---|---|---|---|---|---|---|---|---|---|
| Coexpressed gene list |
[Coexpressed gene list for AT4G13550] | ||||||||||||||||||||||||||||||||||||||||
| Gene expression | |||||||||||||||||||||||||||||||||||||||||
| All samples | [Expression pattern for all samples] | ||||||||||||||||||||||||||||||||||||||||
| AtGenExpress* (Development) |
254715_at
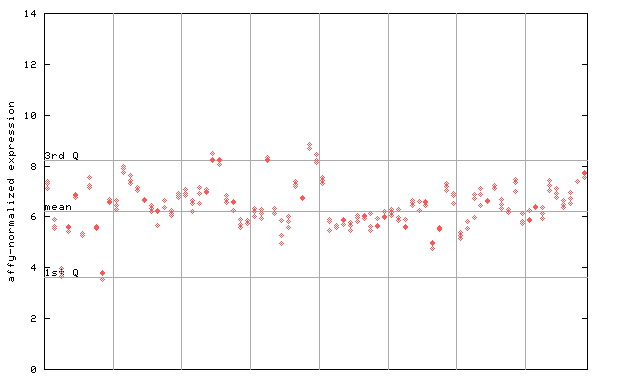
X axis is samples (pdf file), and Y axis is log2-expression. |
||||||||||||||||||||||||||||||||||||||||
| AtGenExpress* (Stress) |
254715_at
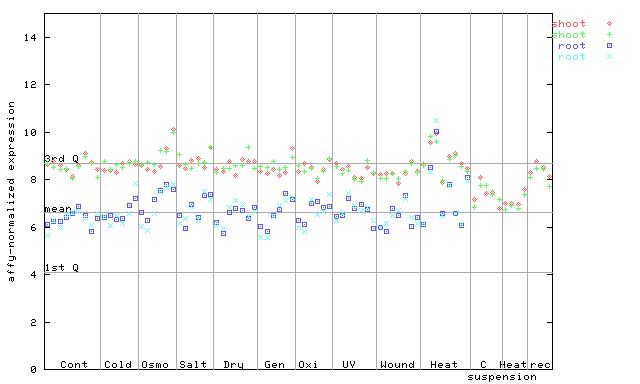
X axis is samples (pdf file), and Y axis is log2-expression. |
||||||||||||||||||||||||||||||||||||||||
| AtGenExpress* (Hormone) |
254715_at
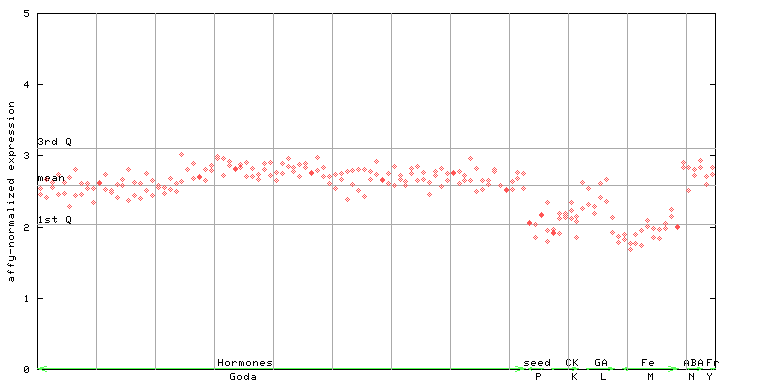
X axis is samples (xls file), and Y axis is log-expression. |
||||||||||||||||||||||||||||||||||||||||


| Link to other DBs | ||
| Entrez Gene ID | 826988 |
|
| Refseq ID (protein) | NP_001319920.1 | |
| NP_001328226.1 | |
|
| NP_001328227.1 | |
|
The preparation time of this page was 0.1 [sec].