[←][→] ath
| functional annotation | ||||||||||||||||||||||||||||||||||||
| Function | acylaminoacyl-peptidase-like protein |


|
||||||||||||||||||||||||||||||||||
| GO BP |
|
|||||||||||||||||||||||||||||||||||
| GO CC |
|
|||||||||||||||||||||||||||||||||||
| GO MF |
|
|||||||||||||||||||||||||||||||||||
| KEGG | ||||||||||||||||||||||||||||||||||||
| Protein | NP_001319939.1 | |||||||||||||||||||||||||||||||||||
| BLAST | NP_001319939.1 | |||||||||||||||||||||||||||||||||||
| Orthologous | [Ortholog page] LOC4348626 (osa) LOC4348628 (osa) LOC11420124 (mtr) LOC11429366 (mtr) LOC100242540 (vvi) LOC100281428 (zma) LOC100285393 (zma) LOC100803600 (gma) LOC100812681 (gma) LOC101258623 (sly) LOC101264860 (sly) LOC101265168 (sly) LOC103833453 (bra) LOC103868336 (bra) LOC103872033 (bra) | |||||||||||||||||||||||||||||||||||
| Subcellular localization wolf |
|
|||||||||||||||||||||||||||||||||||
| Subcellular localization TargetP |
|
|||||||||||||||||||||||||||||||||||
| Gene coexpression | ||||||||||||||||||||||||||||||||||||
| Network*for coexpressed genes |
|
|||||||||||||||||||||||||||||||||||
|---|---|---|---|---|---|---|---|---|---|---|---|---|---|---|---|---|---|---|---|---|---|---|---|---|---|---|---|---|---|---|---|---|---|---|---|---|
| Coexpressed gene list |
[Coexpressed gene list for AARE] | |||||||||||||||||||||||||||||||||||
| Gene expression | ||||||||||||||||||||||||||||||||||||
| All samples | [Expression pattern for all samples] | |||||||||||||||||||||||||||||||||||
| AtGenExpress* (Development) |
245594_at
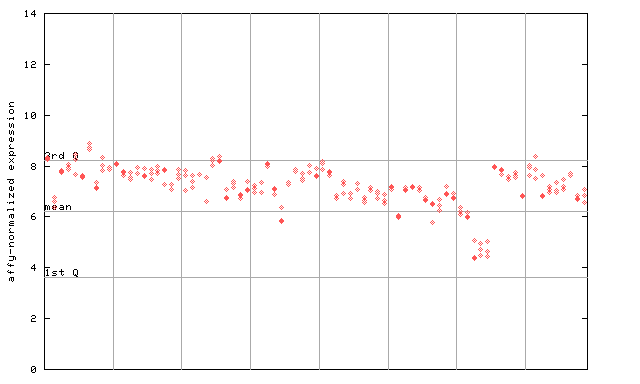
X axis is samples (pdf file), and Y axis is log2-expression. |
|||||||||||||||||||||||||||||||||||
| AtGenExpress* (Stress) |
245594_at
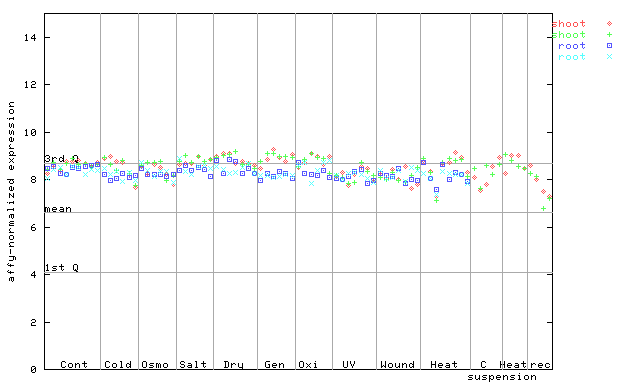
X axis is samples (pdf file), and Y axis is log2-expression. |
|||||||||||||||||||||||||||||||||||
| AtGenExpress* (Hormone) |
245594_at
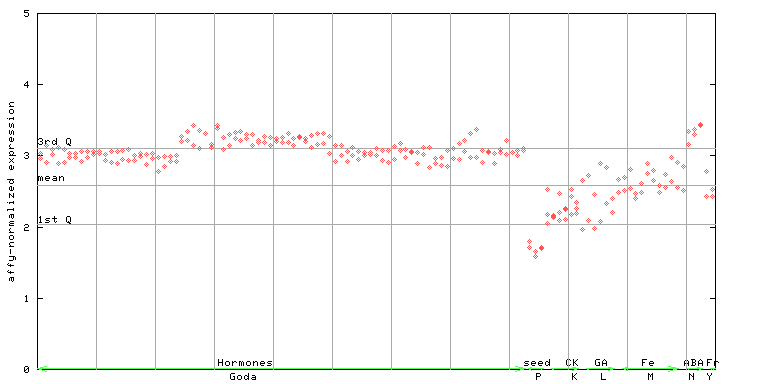
X axis is samples (xls file), and Y axis is log-expression. |
|||||||||||||||||||||||||||||||||||


| Link to other DBs | ||
| Entrez Gene ID | 827104 |
|
| Refseq ID (protein) | NP_001319939.1 | |
The preparation time of this page was 0.2 [sec].