[←][→] ath
| functional annotation | |||||||||||||||||||||||||||||||
| Function | ATP-dependent RNA helicase |


|
|||||||||||||||||||||||||||||
| GO BP |
|
||||||||||||||||||||||||||||||
| GO CC |
|
||||||||||||||||||||||||||||||
| GO MF |
|
||||||||||||||||||||||||||||||
| KEGG | |||||||||||||||||||||||||||||||
| Protein | NP_001328228.1 NP_193215.2 | ||||||||||||||||||||||||||||||
| BLAST | NP_001328228.1 NP_193215.2 | ||||||||||||||||||||||||||||||
| Orthologous | [Ortholog page] LOC4334089 (osa) LOC7474187 (ppo) LOC11438666 (mtr) LOC100264771 (vvi) LOC100273495 (zma) LOC100789328 (gma) LOC100807810 (gma) LOC101250735 (sly) LOC103871628 (bra) | ||||||||||||||||||||||||||||||
| Subcellular localization wolf |
|
||||||||||||||||||||||||||||||
| Subcellular localization TargetP |
|
||||||||||||||||||||||||||||||
| Gene coexpression | |||||||||||||||||||||||||||||||
| Network*for coexpressed genes |
|
||||||||||||||||||||||||||||||
|---|---|---|---|---|---|---|---|---|---|---|---|---|---|---|---|---|---|---|---|---|---|---|---|---|---|---|---|---|---|---|---|
| Coexpressed gene list |
[Coexpressed gene list for ATSUV3] | ||||||||||||||||||||||||||||||
| Gene expression | |||||||||||||||||||||||||||||||
| All samples | [Expression pattern for all samples] | ||||||||||||||||||||||||||||||
| AtGenExpress* (Development) |
245578_at
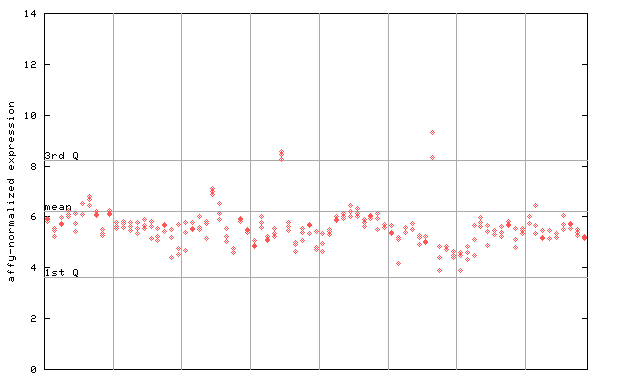
X axis is samples (pdf file), and Y axis is log2-expression. |
||||||||||||||||||||||||||||||
| AtGenExpress* (Stress) |
245578_at
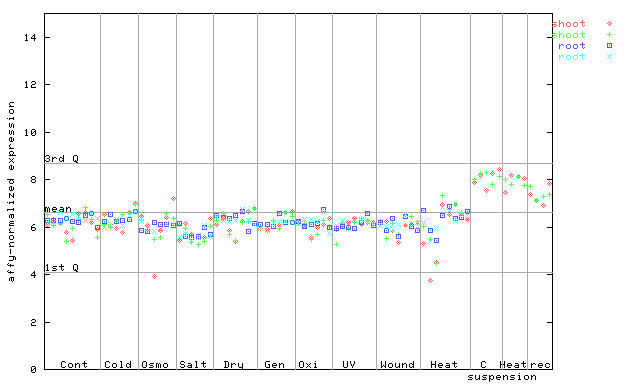
X axis is samples (pdf file), and Y axis is log2-expression. |
||||||||||||||||||||||||||||||
| AtGenExpress* (Hormone) |
245578_at
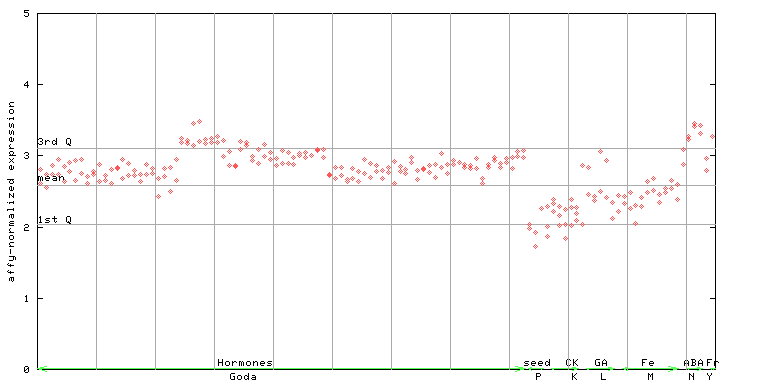
X axis is samples (xls file), and Y axis is log-expression. |
||||||||||||||||||||||||||||||


| Link to other DBs | ||
| Entrez Gene ID | 827134 |
|
| Refseq ID (protein) | NP_001328228.1 | |
| NP_193215.2 | |
|
The preparation time of this page was 0.2 [sec].